

|
|
|
Examining the U.S. Foreign Born Population -- Population by Country of Birth by Census Tract
The U.S. foreign born population includes anyone who is not a U.S. citizen at birth, including those who have become U.S. citizens through naturalization. The native born population includes anyone who is a U.S. citizen at birth, including those who were born in the U.S., Puerto Rico, a U.S. Island Area or abroad to U.S. citizen parent(s). Start using the interactive table below to examine foreign born population by country by census tract. Chinese Foreign Born Population & $MHI Patterns; New York City Area - red markers show census tracts with 500 or more Chinese foreign born - neighborhood level views provide insights into patterns of economic prosperity - census tract thematic patterns of median household income 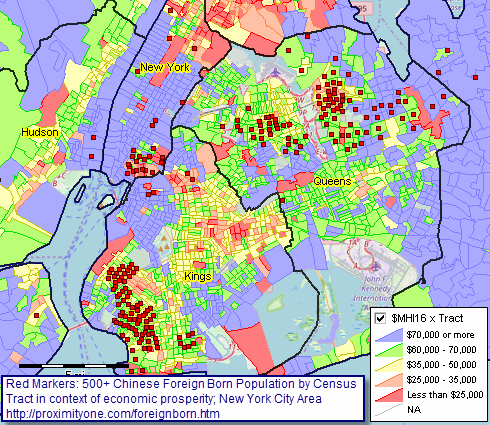 - view developed with CV XE GIS software using related GIS project and datasets. See additional views of foreign born communities below in this section. Importance of the Foreign Born Data ... knowing about the geographic, demographic and economic attributes of the foreign born population tells us about the size, distribution and characteristics of the immigrant population. Projections of the foreign born population tell us how our country will grow. See more below. • Demographic-economic attributes: U.S. total, native & foreign born population • Foreign born graphics (pdf) • Projections to 2060 (xls) This section provides data and data analytics tools to examine the U.S. foreign born population by detailed country of birth by census tract. Use the interactive table below to examine patterns of the foreign born population by country by census tract (all U.S. census tracts) for the U.S. or by selected metro or county. See characteristics of the foreign born population by census tract in context of other demographic-economic measures using this related table. The Chinese foreign born population is used in the graphics below to illustrate. Other population groups could have been used. Based on the ACS estimates, there are 851 census tracts having 500 or more Chinese foreign born population (of a total 73,056 tracts). Twenty of the 25 tracts having the largest number of Chinese foreign born population are located in New York City. Determine which tracts using the interactive table below. Chinese Foreign Born Population Patterns - China is one of 162 country/country groups reviewed in this section - red markers show census tracts with 500 or more Chinese foreign born - the distribution is wide and difficult to gain insights 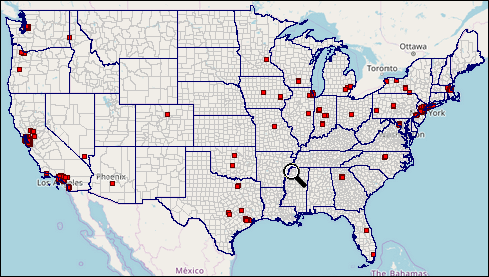 - view developed with CV XE GIS software using related GIS project and datasets. Chinese Foreign Born Population Patterns; New York City Area - red marker shows census tract with 500 or more Chinese foreign born - neighborhood level views provide improved insights into patterns 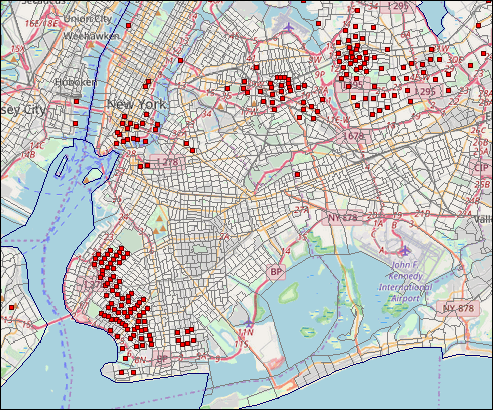 - view developed with CV XE GIS software using related GIS project and datasets. Foreign Born Population by Country/Place of Birth - U.S. ACS estimates
Foreign Born Population by Country of Birth by Census Tract interactive table -- goto top ACS estimates Click ShowAll button between Find/Queries. Use mouseover on column header to view column description. See usage notes below table. See related -- interactive tables. Usage Notes • If table not showing any rows; click ShowAll button below table. • Use vertical and horizontal scroll bars to navigate up/down or left/right. • Adjust column widths using column divider between header cells. • CBSA> button -- use to select tracts in a specified metro/CBSA .. get metro 5-character code here .. paste the 5-character metro code in the edit box to right of CBSA> button. .. click the CBSA> button ... table refreshes with all tracts in specified metro. • StCty> button -- use to select tracts in a specified county .. get county 5-character code here .. paste the 5-character state-county code in the edit box to right of StCty> button. .. click the StCty> button ... table refreshes with all tracts in specified metro. • Selected columns -- click the "CentAmerica" button to show only Central America country columns; .. click "All columns" button to restore view to all columns. • Click ShowAll button between specific area queries. • Cells with negative value could not be estimated (for this geography and this time frame). Communities of Foreign Born Population .. goto top These additional views illustrate how selected foreign born country population clusters in many cases. Some develop communities without real boundaries or any formally designated structure. Use the GIS project and tools to develop your own views for country combinations and areas of interest. India Foreign Born Population & $MHI Patterns; New York City Area - red markers show census tracts with 500 or more India foreign born - neighborhood level views provide insights into patterns of economic prosperity - census tract thematic patterns of median household income 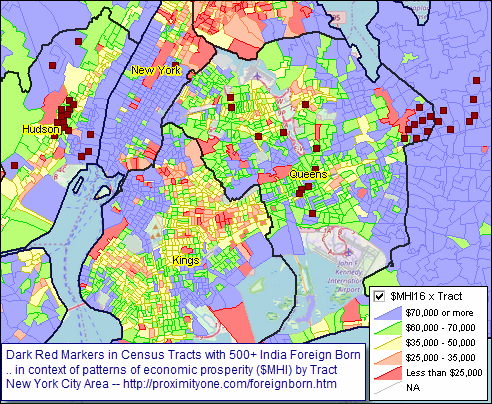 - view developed with CV XE GIS software using related GIS project and datasets. Asia Foreign Born Population & $MHI Patterns; Houston, TX Area - red markers show census tracts with 500 or more Asia foreign born .. all Asia countries (item 047 in country list above in this section - neighborhood level views provide insights into patterns of economic prosperity - census tract thematic patterns of median household income 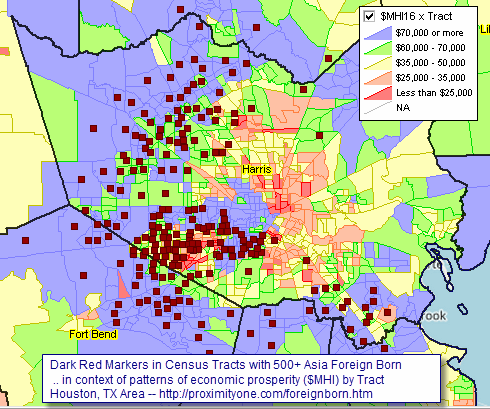 - view developed with CV XE GIS software using related GIS project and datasets. Cuba Foreign Born Population & $MHI Patterns; Miami, FL Area - red markers show census tracts with 500 or more Cuba foreign born - neighborhood level views provide insights into patterns of economic prosperity - census tract thematic patterns of median household income 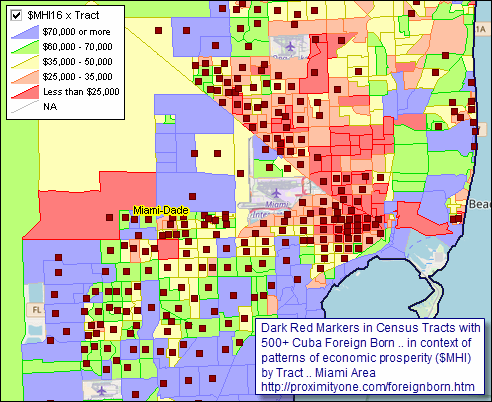 - view developed with CV XE GIS software using related GIS project and datasets. Vietnam Foreign Born Population & $MHI Patterns; Los Angeles, CA Area - red markers show census tracts with 500 or more Vietnam foreign born - neighborhood level views provide insights into patterns of economic prosperity - census tract thematic patterns of median household income 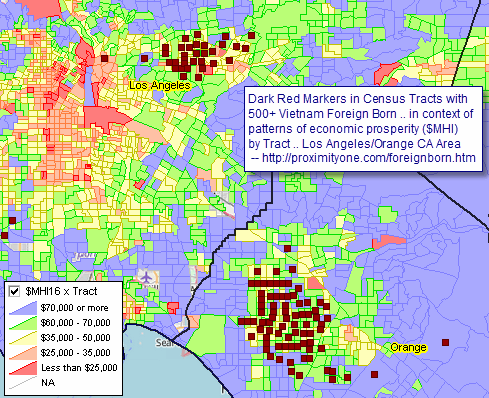 - view developed with CV XE GIS software using related GIS project and datasets. Importance of the Foreign Born Data .. goto top knowing about the geographic, demographic and economic attributes of the foreign born population tells us about the size, distribution and characteristics of the immigrant population. Projections of the foreign born population tell us how our country will grow. Those who are among the foreign born population of a specific country of origin/birth can use these data to better understand needs, challenges and opportunities for their population group down to the neighborhood level. Learning and education opportunities and outcomes may differ substantially between the native and foreign born populations; some foreign born populations are often higher academic achievers than the native born population in the same area. The skill set, particularly in scientific and technical occupations, of some foreign born groups exceeds that of the native born population in the same area -- important for businesses hiring in this occupational group. Many businesses, government agencies and associations work with a clientele who are foreign born population with specific country(s) of origin -- these data provide important management and decision-making information. The "Dreamer" population, young unauthorized immigrants receiving work permits and deportation relief through the Deferred Action for Childhood Arrivals (DACA) program, are part of this group. Understanding foreign born population trends, including natality, mortality and migration, is important for many these data uses. Support Using these Resources .. goto top Learn more about accessing and using demographic-economic data and related analytical tools. Join us in a Data Analytics Lab session. There is no fee for these one-hour Web sessions. Each informal session is focused on a specific topic. The open structure also provides for Q&A and discussion of application issues of interest to participants. ProximityOne User Group Join the ProximityOne User Group to keep up-to-date with new developments relating to metros and component geography decision-making information resources. Receive updates and access to tools and resources available only to members. Use this form to join the User Group. Additional Information ProximityOne develops geodemographic-economic data and analytical tools and helps organizations knit together and use diverse data in a decision-making and analytical framework. We develop custom demographic/economic estimates and projections, develop geographic and geocoded address files, and assist with impact and geospatial analyses. Wide-ranging organizations use our tools (software, data, methodologies) to analyze their own data integrated with other data. Contact us (888-364-7656) with questions about data covered in this section or to discuss custom estimates, projections or analyses for your areas of interest. |
|
|