
|
|
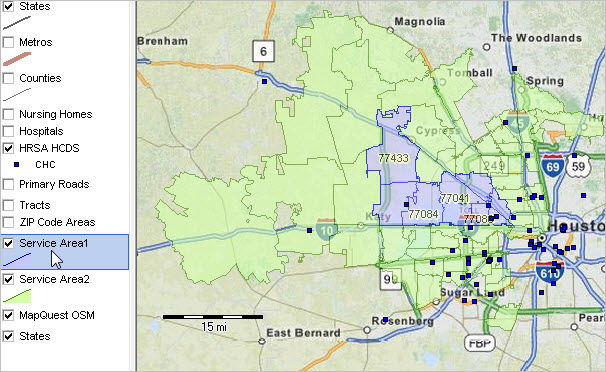
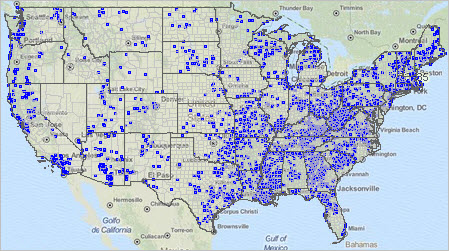
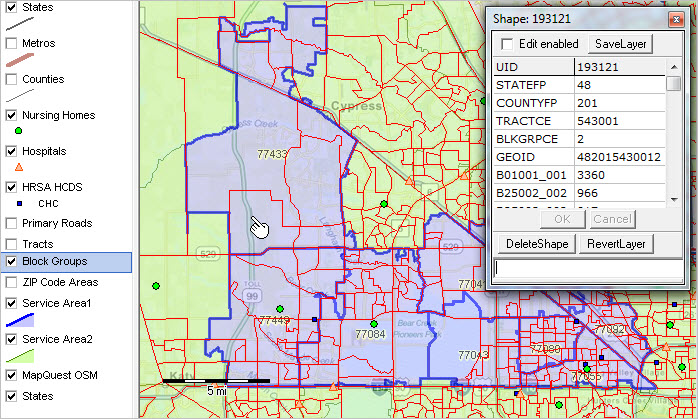
-- expanding insights through data analytics Community Health Centers are an important part of the U.S. health care delivery system. Community Health Centers (CHCs) are organizations that participate in the Health Resources and Services Administration (HRSA), Bureau of Primary Health Care (BPHC) U.S. Public Health Service Act Section 330 programs. See more about CHCs below in this section. Spring Branch Community Health Center The following graphic shows the Spring Branch Community Health Center, Texas (Houston area) service area. This type of GIS project has been developed for each/all approximate 1,300 CHCs -- see full list of CHCs in table below. The blue ZIP code areas are those where the health center draws patients cumulative to 75% of total. The green ZIP code areas are those where the health center draws patients cumulative to 75% to 100%. Click graphic for larger view. Expand browser window for best quality view.  - View developed using CV XE GIS and related GIS project. - See more about structure and use of CHC GIS projects below in this section GIS Project Start-Up Views -- Houston CHCs • Asian American Health Coalition dba Hope Clinic • Bee Busy Wellness Center • El Centro De Corazon • Fourth Ward D.B.A Good Neighbor Healthcare Center • Harris County Hospital District • Healthcare for the Homeless--Houston • Houston Area Comnty Services Inc. • Houston Community Health Centers Inc. • Legacy Community Health Services Inc. • Saint Hope Foundation • South Central Houston Action Council Inc. • Spring Branch Community Health Center CHCs are part of the broader neighborhood and community infrastructure. The ability of a CHC to understand the demographic-economic characteristics, conditions and trends are important to the success of the CHC and the overall area served. The ability of the community and region stakeholders to understand the how CHCs interface with the broader health care delivery infrastructure is equally important. ProximityOne develops and integrates geographic, demographic, economic and business data about, and relating to, CHCs and provides data analytics services to CHC stakeholders. This section provides access to some of these data and tools. Community Health Center Patterns & Distribution Using GIS tools ... the following graphic shows the approximately 5,600 HRSA funded regular Community Health Center (CHC) locations. There are a total of more than 10,000 HRSA funded health care delivery system locations. Click graphic for larger view.  - View developed using CV XE GIS and related GIS project. Related Health Data Analytics Sections • Community Health Centers & Data Analytics • Geographic Information Systems & Geospatial Analysis -- market & infrastructure analysis • Healthcare Decision-Making Information • Healthcare Industry Composition • County Health Patterns • Health Insurance Coverage • Disability Status by Gender & Age • Life Expectancy by County Using the Community Health Centers Interactive Table An example focused on the Spring Branch Community Health Center (shown in map graphic at top of this section). • Click ShowAll button below table to reset the table to all CHCs. • Click the Find-in-City button below the table to select CHCs in Houston; the table refreshes. • Click the Patients 2014 column header cell; the table sorts in ascending order on this column. .. click again to sort descending; Spring Branch Community Health Center now appears as third largest in list. .. in 2014 this CHC served 12,277 patients with an average patient cost of $399. • Sorting on per patient cost 2014 (rightmost column), this CHC is number 10 among the 12 CHCs in Houston. .. note that cost might be not comparable across CHCs -- patient services vary by CHC affecting cost. .. note that this set of CHCs has a city location of "Houston" -- but there are other CHCs in this area/metro. • Examining this CHC relative to all Texas CHCs ... .. click ShowAll button below table to reset the table to all CHCs. .. click State dropdown below table and selected Texas; table refreshes to Texas CHCs only. .. click Patients 2014 column header cell twice (to sort table in descending order on this item). .. scroll down to find Spring Branch Community Health Center is the 29th largest among 70 Texas CHCs. .. perform similar ranking/comparative analyses on other items/columns. • Examining this CHC relative to a Patients size peer group ... .. click ShowAll button below table to reset the table to all CHCs. ... in min and max edit boxes ... .... enter the minimum 2014 patients in the left edit box -- 12000 (an example). .... enter the maximum 2014 patients in the right edit box -- 13000 (an example). .. click the "Patient 2014 Min & Max" button; table refreshes with only this group. .. see in the table that there are 4 CHCs in Texas is this size group and 35 in the U.S. .. optionally click links to view their attributes. .. perform rankings/comparative analyses on selected items/columns. • Click ShowAll button and examine CHCs of interest. Community Health Centers Interactive Table Click ShowAll button between Find/Queries. Click column header cell to sort table on that column; click again to sort other direction. Use mouseover on column header to view column description. See usage notes below table. See demographic-economic interactive tables. Usage Notes • -1 value indicates data not available. • Click ShowAll between queries/filters. • Click a column header to sort on that column; click again to sort other direction. • State button .. select a state to have the table refresh with rows for only that state. • Find-in-Name button .. enter a partial case-sensitive CHC name in the edit box to right of Find-in-Name button. .. click to Find-in-Name button to show only rows with that text in the CHC name (column 1). • Find-in-City button .. enter a partial case-sensitive city name in the edit box to right of Find-in-City button. .. click to Find-in-City button to show only rows with that text in the city name (column 3). • Patients 2014 Min & Max> button .. click to show only peer group counties based on values .. the ShowAll button must be clicked before using this feature. .. in min and max edit boxes ... ... enter the minimum 2014 patients in the left edit box. ... enter the maximum 2014 patients in the right edit box. .. click Patients 2014 Min & Max button to view CHCs in peer group. • Click ShowAll between queries/filters. More About CHCs CHCs, also referred to Federally-qualified health centers (FQHCs). have been approved for reimbursement programs under Medicare and Medicaid. To participate as a FQHC, the organization must meet numerous criteria including management, quality of care, scope of services and cost standards. Medicare and Medicaid pay these organizations on a cost-based or cost-derived (usually higher) basis than published fee schedules. FQHCs have the opportunity to apply their reimbursement benefits to managed care enrollees under Medicaid. CHC GIS Projects The graphic shown below presents a variation (zoom-in Area 1 blue service/ZIP code areas - per HRSA definition) of the view of this CHC service area shown at the top of this section. This view illustrates how easy it is to add block group (red boundaries) smaller area geography to examine demographic-economic characteristics. ZIP code areas often have a population size too large for the best possible demographic analyses. The pointer illustrates how one block group (48-201-543001-2 with population 3,360) relates to corresponding ZIP code area 77433 with population 60,324. All nursing homes, hospitals and CHC locations (separate layers shown in legend panel at left) have been click-on and show in the map window. Optionally apply queries on these facilities to view only selected facilities. Benefits from using the CHC projects ... • Use these GIS projects/datasets on your computer without sharing confidential data. • Flexibly add any geocoded data or additional/different types of geography and subject matter. • Benefit from improved presentation quality to create and publish graphics. • Flexibly re-define service areas; simply change the query on a layer to add or remove a ZIP code area. • Optionally add census block level geography/demographics. • Alternatively define service areas as groups of census tracts. .. offering twice the geographic granularity. .. more consistent with other clinical and epidemiological small area data.  - View developed using CV XE GIS and related GIS project. ProximityOne User Group Join the ProximityOne User Group to keep up-to-date with new developments relating to metros and component geography decision-making information resources. Receive updates and access to tools and resources available only to members. Use this form to join the User Group. Support Using these Resources Learn more about accessing and using demographic-economic data and related analytical tools. Join us in a Data Analytics Lab session. There is no fee for these one-hour Web sessions. Each informal session is focused on a specific topic. The open structure also provides for Q&A and discussion of application issues of interest to participants. Additional Information ProximityOne develops geodemographic-economic data and analytical tools and helps organizations knit together and use diverse data in a decision-making and analytical framework. We develop custom demographic/economic estimates and projections, develop geographic and geocoded address files, and assist with impact and geospatial analyses. Wide-ranging organizations use our tools (software, data, methodologies) to analyze their own data integrated with other data. Follow ProximityOne on Twitter at www.twitter.com/proximityone. Contact us (888-364-7656) with questions about data covered in this section or to discuss custom estimates, projections or analyses for your areas of interest. |
|
|