CV XE GIS Home Page


  ProximityOne Home Page

  Situation & Outlook

  Related Sections
  - Applications Gallery
  - States
  - School Districts
  - Metros
  - Congressional District
  - Counties
  - Tracts/Neighborhoods
  - Block Groups
  - Census Blocks
  - ZIP Codes
  - Urban Areas

  Estimates-Projections
  - 2060 Demographic
    ... all county interactive table
  - 2030 Demographic-Economic
  - Single Year of Age

  GIS Thematic Mapping
    Visual Analysis Tools

  Ranking Tables
    National Scope
    Demographic Change
    2000-2010
  - States
  - Metros
  - Congressional District
  - School Districts
  - Counties
  - Cities/Places
  - Census Tracts


Healthcare Data Analytics
  -- using Geographic Information Systems & Geospatial Analysis
Decision-Making Information
  ProximityOne
  information resources & solutions
  (888) DMI-SOLN
  (888) 364-7656


Put data to work more effectively.
Certificate in Data Analytics


Visual analysis with ProximityOne tools
click graphic for info; hover to pause

 
visually analyze clients/markets
site analysis using 1 mile radius

S1

$median household income
patterns by census tract - Houston

hover to pause

113th Congressional Districts

Click for info

US Asian Indian population 2010

Click for info

geocoded students and school
McKinney ISD, TX

Click for info

geocoded students and school
with tax parcels & streets

Click for info

high school attendance zones
with schools by type

Click for info

%high school graduates by
census tract - Puerto Rico

Click for info

Austin, TX MSA counties &
places 10K+ population markers

Click for info

Appalachia counties (green) &
coalfield counties (orange)

Click for info

China provinces percent urban &
cities (markers) by state plan

Click for info

Honolulu census tracts (red)
& census blocks


Central Park area NYC

Click for info

Kansas City Metro & Counties
Home Depot locations (markers)

Click for info

World Cities; focus on Spain

Click for info


Data Analytics Blog
Mapping Statistical Data

Support & Technical Assistance
help using these resources


Healthcare data analytics involve the use of tools, data and methodologies that enable stakeholders to better understand and develop insights into patterns, characteristics and trends relating to healthcare provider, consumers, markets and more. Healthcare data analytics might be focused on a single healthcare provider and its market ... ranging to regional/national/global scope analyses of health and healthcare attributes.

This section is focused on using Geographic Information System (GIS) tools and related data resources for use in healthcare data analytics. GIS tools and data are essential to linking and analyzing separately sourced subject matter and different types of geographic areas and features. Participants in the Certificate in Data Analytics may optionally use the tools and resources described here. See overview below of steps to install and use the GIS project and datasets illustrated in this section.

Geography & Lay of the Land
The graphic presented below shows the geographic region focus -- New Hampshire-Maine area. Most geography and related subject matter data used are for this two-state region. These same geography and subject matter can be developed for any area in the U.S. This graphic shows states with blue boundaries. Urban areas are shown by a census block layer; urban census blocks are shown with an orange fill pattern. Click graphic for larger view.

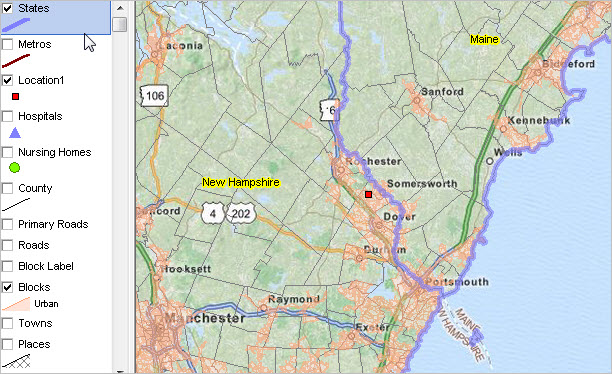
.. view developed with ProximityOne CV XE GIS and related GIS project.

GIS Project & Data Resources
The next graphic shows the GIS project start-up view using the CV XE GIS software. This graphic shows a zoom-in view/variation of the above map with a few different layer settings. See the GIS project installation notes below in this section. Click graphic for larger view.

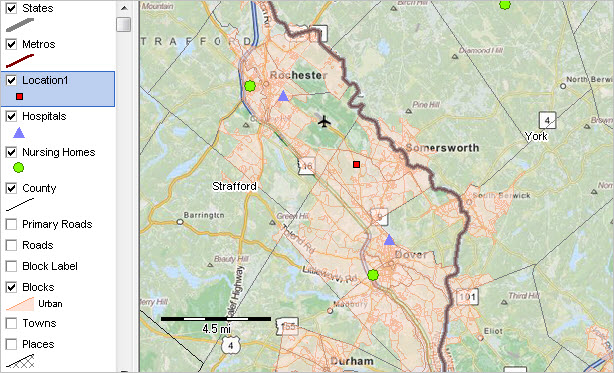
.. view developed with ProximityOne CV XE GIS and related GIS project.

How this GIS Project, Tools & Datasets Relates to Healthcare Data Analytics
These tools and data can tell stakeholders a lot about healthcare characteristics, patterns and trends. They are also replicable for the same scope of geography and subject matter anywhere in the U.S. They are updatable as geographic, demographic and economic data are updated or extended. By the nature of GIS applications, they enable us to link together somewhat unrelated geography and subject matter to provide more comprehensive insights. Also by the nature of GIS applications, it offers the ability to provide visual representation of patterns and change that can facilitate collaborative thinking faster than using tabular data alone.

At "start-up", this GIS project tells a great deal about the geo-demographic-economic landscape. It provides the ability to analyze subject matter, already preloaded in the component "shapefiles" that require a bit of tweaking to reveal patterns. This is the way we would want it -- an expandable, dynamic analytical resource with already embedded extensive data.

The project offers the capability to integrate any of the data from Census 2010 and American Community Survey for key small area geography. It is easily expanded to include other layers that could be useful such as Public Use Microdata Sample (PUMS) custom estimates for Public Use Microdata Areas (PUMAs), schools/education agencies, legislative/congressional districts, among others.

The GIS project also offers other types of expandability. Additional subject matter, such a demographic-economic projections, can be added to already existing geography and layers. New geography, such as medically underserved areas or healthcare professional shortage areas can be added. Geocoded patient/client and provider data can be added as new layers. Subject matter from yet other sources, like the HRSA Area Health Resources Files, can be integrated into existing geographic layers.

Many healthcare data analytics applications are of a national or multi-country orientation and less focused on regional or subnational analysis. This GIS project, datasets and tools support national and multi-country analyses. The following view shows patterns of percent civilian non-institutionalized population with health insurance by census tract for the U.S. (ACS 2014 5-year estimates). A similar view could be developed using county-level geography. Using the GIS project, develop variations of this view: different universes, different intervals, different colors, alternative zoom views.

Percent Civilian Non-institutionalized Population with Health Insurance by Census Tract

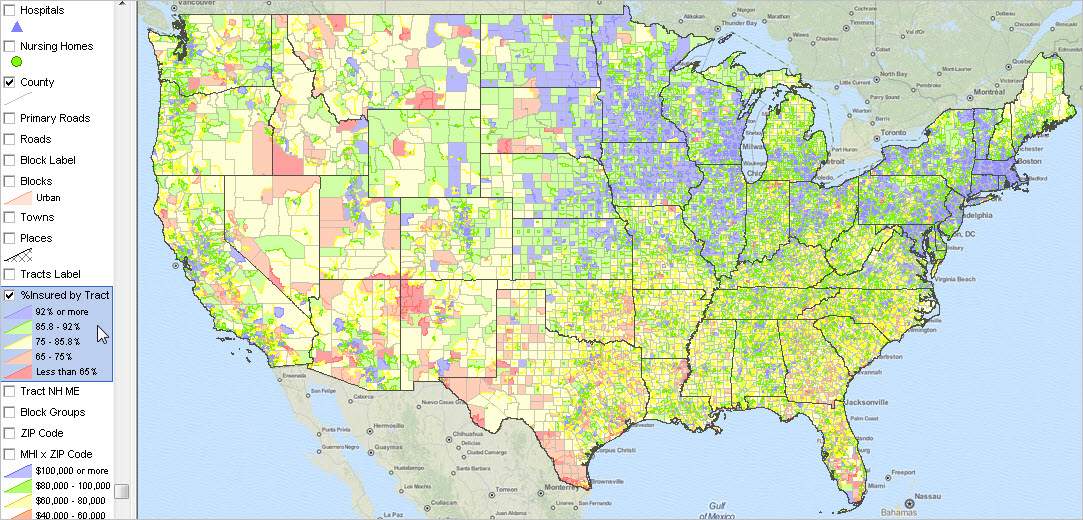
.. view developed with ProximityOne CV XE GIS and related GIS project.
.. see notes below in this section about health insurance coverage data.
.. zoom-in views and details
  • Chicago area
  • Houston area
  • Los Angeles area
  • ACS questionnaire health insurance coverage question

Getting Started with the Healthcare Data Analytics GIS Project
1. Install CV XE GIS software
... Install package -- Windows 32/64
... Start-up Readme
... Optional settings -- enable a wider set of features
    - add your CV XE UserID to the Key edit box in Settings (more information).
Next steps:
2. Install the Healthcare Data Analytics GIS Project/Datasets
... requires Data Analytics UserID provided separately.
... it is recommended that the hda1.zip (next item) be expanded into the new folder c:\hda1.
... unzip/expand http://proximityone.com/data_analytics/1/hda1.zip to folder c:\hda1
3. Initial start-up
... after completing the above steps and with CV XE running (use desktop icon)
... use File>Open>Dialog to open the project file named c:\hda1\hda1.gis
... the view shown below should appear.

Click graphic for larger view

See the description of shapefiles/layers used in the project below this section.

Using the Healthcare Data Analytics GIS Project
1. General Operations
  • Start CV XE GIS using the desktop icon.
  • Exit the CV XE GIS using the File>Exit operation.
  • After opening a project, no changes are made to a project unless an explicit File>Save or File>SaveAs is used.
  • After opening a project, save changes using File>Save or File>SaveAs operation.
    - Project file names always use the extension ".gis".
    - File>Save will overwrite the existing project with current settings immediately.
    - File>SaveAs will overwrite the new-named project with current settings immediately.
    - It is recommended that all files used in the project be located in the folder c:\hda1
    - File>Save is not recommended using the original project name -- c:\hda1\hda1.gis.
    - File>Save is recommended only for experienced users
        or on a new project name variation (e.g., c:\hda1\hda2.gis).
    - Use File>SaveAs to create the existing project settings as a new project name (e.g., c:\hda1\hda2.gis).

  • For general software usage information, see the CV XE GIS User Guide.
  • General Operation and Navigation. See CV XE GIS User Guide navigation section.
  • When CV XE GIS starts, it will attempt to open the GIS project named in the (start-up settings).
    - to open project directly use File>Open>Dialog to open the project file named c:\hda1\hda1.gis

2. Tutorial steps; open c:\hda\hda1.gis and proceed as follows:
2.1. Perform these orienteering steps:
2.1.1. Making a layer visible/non-visible.
      .. in the legend panel, uncheck the Locations layer checkbox, it is then no longer shown in the map window.
      .... the red marker represents a single "shape" or "object" as defined in corresponding "point shapefile".

2.1.2. Zooming in/out.
    - use the zoom tool to zoom-in to the box shown in this graphic:
     
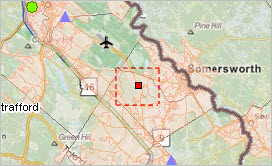
    - check the checkbox on the Roads layer in the legend panel. Roads now display:
     

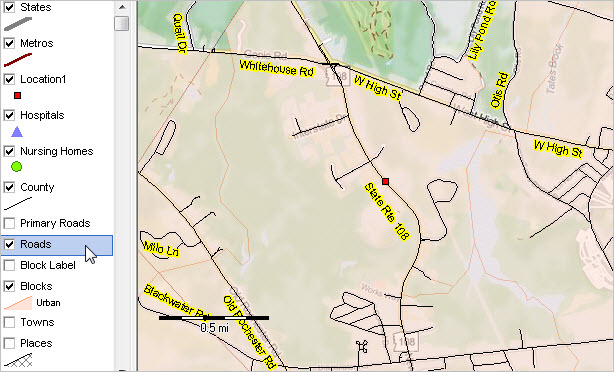
2.1.3. Saving a new project file.
    - Use File>SaveAs and save the existing project file as c:\hda1\hda2.gis.
    - Close CV XE GIS and re-start.
    - Use File>Open>Dialog and open the project file c:\hda1\hda2.gis. Note that the settings are those as last used.

2.1.4. Using the Identify Tool.
    - Use File>Open>Dialog and open the project file c:\hda1\hda2.gis.
    - Click the Roads layer name in the legend panel; the layer highlights blue.
      .. this makes the layer the "active layer".
    - Verify that the mouse tool (click pointer symbol in toolbar) is selected/active.
    - Click the road segment by red location marker mini-profile displays as shown in graphic below.
    - The profile shows values for attributes/fields in the roads layer shapefile dbase file.
    - The location address is 311 Route 108 .. note this address is shown to be within the right side address range.
       

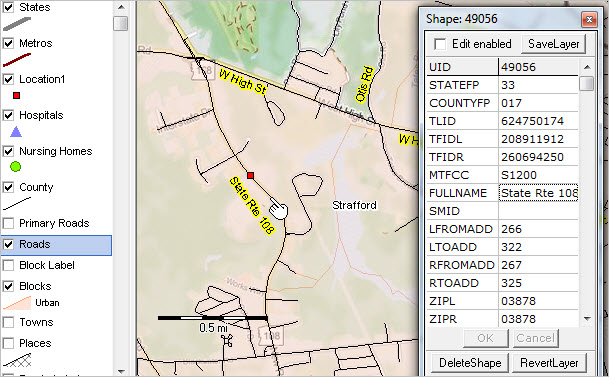
2.1.5. Using the Layer Editor.
    - Use File>Open>Dialog and open the project file c:\hda1\hda1.gis.
    - The Layer Editor enables modification of which and how shapes/objects are shown in the map window.
    - Check the Blocks Label layer checkbox. All populate with a label that is the total Census 2010 population.
    - Dbl-click the Blocks Label layer name in legend to start Layer Editor;
      .. editor form displays as shown in graphic below.
    - Click Label tab and change the display item (Field) from Pop100 to HU100 (housing units).
      .. cclick OK button that closes Editor.
    - The map view now shows blocks labeled with housing units..
    - Uncheck the Block Label layer to show no label.
       

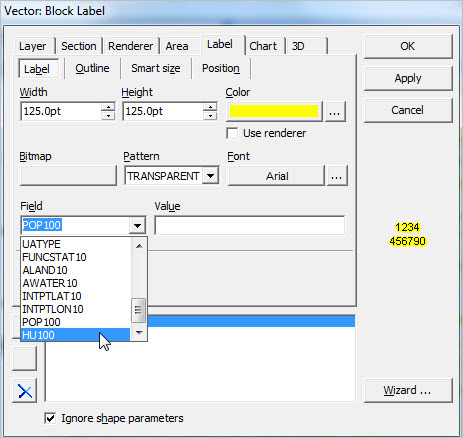
2.2. Census Tract & ZIP Code Area Demographic-Economic Characteristics
    - census block and block group demographics covered separately
2.2.1. Outlook tool (not part of CV XE GIS) used to develop demographic-economic profiles:
      .. "Location 1" located in ZIP 03878 and tract 33017083001
      .. ZIP 03878 is a near equivalence of tracts 33017083001 and 33017083002
        (see about census tract geocodes/names)

      .. ZIP Code Area profile: ZIP 03878-HTML .. ZIP 03878-XLS
      .... create this ZIP view using the GIS project; saving project not required.
       

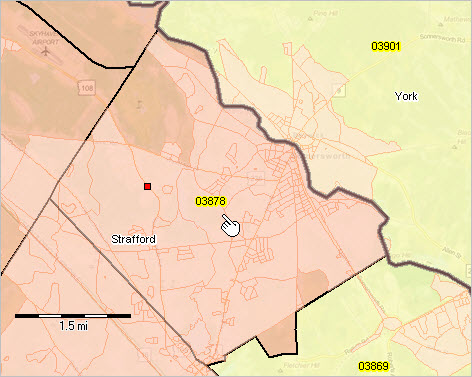
      .. Census Tract 1 profile: Tract 33017083001-HTML .. Tract 33017083001-XLS
      .. Census Tract 2 profile: Tract 33017083002-HTML .. Tract 33017083002-XLS
      .... create this view tracts using the GIS project; saving project not required.
       

2.2.2. Create similar XLS profiles using Identify Tool
    - view/discuss DP3 - Economic Characteristics Profile
      .. XLS for these three geographic areas -- ZIP and two tracts .. from GIS project

2.2.3. Thematic Pattern Views
    - How to visually show which areas have the highest/lowest levels of economic prosperity?
    - Use File>Open>Dialog and open the project file c:\hda1\hda1.gis.
    - The existing view shows thematic pattern: which census blocks are urban.
    - Uncheck the Blocks layer in legend panel. Scroll down in legend panel to MHI x ZIP Code layer.
    - Check the MHI x ZIP Code layer in legend panel; patterns displayed as shown in graphic below.
    - Each ZIP Code area now shows a color pattern corresponding to interval settings shown in legend pattern.
    - To view ZIP code labels, check ZIP Code layer in legend panel; label with any field in shapefile dbase file.
       

2.2.4. Creating a New Thematic Pattern View -- % with Healthcare Insurance
    - How to add a new thematic pattern?
    - Use File>Open>Dialog and open the project file c:\hda1\hda1.gis.
    - Dbl-click Tracts NH ME layer; in Editor create 4 new intervals/sections.
    - Click OK to close Editor..
    - Add a new iteration of tracts-nh-me shapefile above Tracts NH ME in legend panel.
    - Dbl-click new tracts-nh-me layer & start Editor; set name of tracts-nh-me to "Insured by Tract".
      .. set Area to transparent, outline to 0 width and label to E096 (discuss); click OK.
    - View shows %insured by tract based on color/range intervals and labeled with E096 (insured):
       
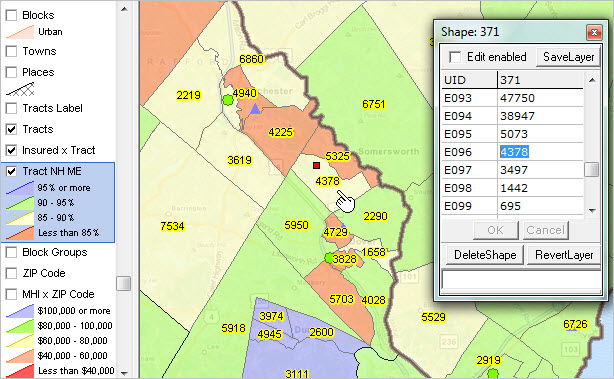
    - Use File>SaveAs and save GIS project as c:\hda1\hda3.gis.

Datasets -- scroll section
The following table provides a summary of layers/shapefiles used in the start-up GIS project.
LayerDescriptionShapefile/Layer Source
1States (U.S.)cb_2014_us_state_500k.shp
2CBSA/Metros (U.S.)cb_2014_us_cbsa_500k.shp
3Locationlocation1.shp
4Hospitals (U.S.)hospitals_110114pts.shp
5Nursing Homes (U.S.)nh1pts.shp
6Counties (U.S.)cb_2014_us_county_500k.shp
7Primary Roads (NH,ME)tl_2015_23_33_prisecroads.shp
8Roads (23031 33017tl_2015_23031_33017_edges.shp
9Census Blocks (NH,ME)tl_2015_23_33_tabblock10.shp
10Census Blocks (NH,ME)tl_2015_23_33_tabblock10.shp
11County Subdivisions/Towns (NH,ME)tl_2015_23_33_cousub.shp
12Cities/Places (NH,ME)tl_2015_23_33_place.shp
13Census Tracts (U.S.)cb_2014_us_tracts_500k.shp
14Census Tracts (U.S.)cb_2014_us_tracts_500k.shp
15Census Tracts (NH,ME)cb_2014_us_tracts_500k_23_33.shp
16Block Groups (NH,ME)tl_2015_23_33_bg.shp
17ZIP Code Areas (U.S.)cb_2014_us_zcta510_500k.shp
18ZIP Code Areas (U.S.)cb_2014_us_zcta510_500k.shp
19Counties (U.S.)cb_2014_us_county_500k.shp
20OpenStreetMaps (World)OpenStreetMaps
21States (U.S.)cb_2014_us_state_500k.shp


Health Insurance Coverage Data & Interactive Table Access
Health insurance coverage data are one of several types of health-related data available in the 2014 ACS 5-year estimates. At the national level, the overall population with health insurance coverage changed from 85.2% in 2012 to 88.3% in 2014. The upper two intervals shown in the health insurance coverage by census tract map shown above are for the percent population with health insurance coverage at or above the national 85.2% level in 2012 (census tract data are only available from the 5-year estimates, the ACS 2014 5 year estimates are centric to 2012).

While health insurance coverage data are available in a range of demographic combinations, 25 health insurance coverage items (see table below) are available from the economic characteristics dataset for selected types of geography in these interactive tables:

ACS 2014 1-Year Tables
Data in these tables are centric to mid-2014.
- U.S., State, CBSA/Metro
- 114th Congressional Districts
ACS 2014 5-Year Tables
Data in these tables are centric to mid-2012 (mid-point of survey period 2010-2014).
- Census Tracts
- ZIP Code Areas
- School Districts
- State Legislative Districts

Scope of Subject Matter Integrated at Tract & ZIP Code Level -- scroll section
228 demographic-economic subject matter items
Item#   Item Description
D001 Total population
D002 Male
D003 Female
D004 Under 5 years
D005 5 to 9 years
D006 10 to 14 years
D007 15 to 19 years
D008 20 to 24 years
D009 25 to 34 years
D010 35 to 44 years
D011 45 to 54 years
D012 55 to 59 years
D013 60 to 64 years
D014 65 to 74 years
D015 75 to 84 years
D016 85 years and over
D017 Median age (years)
D018 18 years and over
D019 21 years and over
D020 62 years and over
D021 65 years and over
D022 18 years and over
D023 Male -- 18 years and over
D024 Female -- 18 years and over
D025 65 years and over
D026 Male -- 65 years and over
D027 Female -- 65 years and over
D028 Total population
D029 One race
D030 Two or more races
D031 One race
D032 One race -- White
D033 One race -- Black or African American
D034 One race -- American Indian and Alaska Native
D039 One race -- Asian
D047 One race -- Native Hawaiian and Other Pacific Islander
D052 One race -- Some other race
D053 Two or more races
D066 Hispanic or Latino (of any race)
D067 Hispanic or Latino (of any race) -- Mexican
D068 Hispanic or Latino (of any race) -- Puerto Rican
D069 Hispanic or Latino (of any race) -- Cuban
D070 Hispanic or Latino (of any race) -- Other Hispanic or Latino
S001 Total households
S002 Family households (families)
S010 Nonfamily households
S015 Average household size
S016 Average family size
S017 Population in households
S052 Population 3 years and over enrolled in school
S053 School Enrollment -- Nursery school, preschool
S054 School Enrollment -- Kindergarten
S055 School Enrollment -- Elementary school (grades 1-8)
S056 School Enrollment -- High school (grades 9-12)
S057 School Enrollment -- College or graduate school
S058 Population 25 years and over
S059 Educational Attainment -- Less than 9th grade
S060 Educational Attainment -- 9th to 12th grade, no diploma
S061 Educational Attainment -- High school graduate (includes equivalency)
S062 Educational Attainment -- Some college, no degree
S063 Educational Attainment -- Associate degree
S064 Educational Attainment -- Bachelor degree
S065 Educational Attainment -- Graduate or professional degree
S066 Educational Attainment -- Percent high school graduate or higher
S067 Educational Attainment -- Percent bachelor's degree or higher
S078 Population 1 year and over
S079 Residence 1 year ago -- population 1 year and over -- Same house
S080 Residence 1 year ago -- population 1 year and over -- Different house in the U.S.
S081 Residence 1 year ago -- population 1 year and over -- Same county
S082 Residence 1 year ago -- population 1 year and over -- Different county
S083 Residence 1 year ago -- population 1 year and over -- Different county -- Same state
S084 Residence 1 year ago -- population 1 year and over -- Different county -- Different state
S085 Residence 1 year ago -- population 1 year and over -- Abroad
S110 Population 5 years and over
S111 Language Spoken at Home -- Population 5 years and over -- English only
S112 Language Spoken at Home -- Population 5 years and over -- Language other than English
S113 Language Spoken at Home -- Population 5 years and over -- Language other than English -- Speak English less than "very well"
S114 Language Spoken at Home -- Population 5 years and over -- Language other than English -- Speak English less than "very well" -- Spanish
S115 Language Spoken at Home -- Population 5 years and over -- Language other than English -- Speak English less than "very well" -- Spanish -- Speak English less than "very well"
E001 Population 16 years and over
E002 In labor force
E003 In labor force -- Civilian labor force
E004 In labor force -- Civilian labor force -- Employed
E005 In labor force -- Civilian labor force -- Unemployed
E006 In labor force -- Armed Forces
E007 Not in labor force
E008 Civilian labor force
E009 Civilian labor force -- Percent Unemployed
E033 Civilian employed population 16 years+ -- industry of employment -- Agriculture, forestry, fishing and hunting, and mining
E034 Civilian employed population 16 years+ -- industry of employment -- Construction
E035 Civilian employed population 16 years+ -- industry of employment -- Manufacturing
E036 Civilian employed population 16 years+ -- industry of employment -- Wholesale trade
E037 Civilian employed population 16 years+ -- industry of employment -- Retail trade
E038 Civilian employed population 16 years+ -- industry of employment -- Transportation and warehousing, and utilities
E039 Civilian employed population 16 years+ -- industry of employment -- Information
E040 Civilian employed population 16 years+ -- industry of employment -- Finance and insurance, and real estate and rental and leasing
E041 Civilian employed population 16 years+ -- industry of employment -- Professional, scientific, and management, and administrative and waste management services
E042 Civilian employed population 16 years+ -- industry of employment -- Educational services, and health care and social assistance
E043 Civilian employed population 16 years+ -- industry of employment -- Arts, entertainment, and recreation, and accommodation and food services
E044 Civilian employed population 16 years+ -- industry of employment -- Other services, except public administration
E045 Civilian employed population 16 years+ -- industry of employment -- Public administration
E051 Total households
E052 Households Income and Benefits -- Less than $10,000
E053 Households Income and Benefits -- $10,000 to $14,999
E054 Households Income and Benefits -- $15,000 to $24,999
E055 Households Income and Benefits -- $25,000 to $34,999
E056 Households Income and Benefits -- $35,000 to $49,999
E057 Households Income and Benefits -- $50,000 to $74,999
E058 Households Income and Benefits -- $75,000 to $99,999
E059 Households Income and Benefits -- $100,000 to $149,999
E060 Households Income and Benefits -- $150,000 to $199,999
E061 Households Income and Benefits -- $200,000 or more
E062 Households Income and Benefits -- Median household income (dollars)
E063 Households Income and Benefits -- Mean household income (dollars)
E075 Families
E076 Families Income and Benefits -- Less than $10,000
E077 Families Income and Benefits -- $10,000 to $14,999
E078 Families Income and Benefits -- $15,000 to $24,999
E079 Families Income and Benefits -- $25,000 to $34,999
E080 Families Income and Benefits -- $35,000 to $49,999
E081 Families Income and Benefits -- $50,000 to $74,999
E082 Families Income and Benefits -- $75,000 to $99,999
E083 Families Income and Benefits -- $100,000 to $149,999
E084 Families Income and Benefits -- $150,000 to $199,999
E085 Families Income and Benefits -- $200,000 or more
E086 Families Income and Benefits -- Median family income (dollars)
E087 Families Income and Benefits -- Mean family income (dollars)
E095 Health Insurance Coverage -- Civilian Noninstitutionalized Population
E096 Health Insurance Coverage -- Civilian Noninstitutionalized Population -- With health insurance coverage
E097 Health Insurance Coverage -- Civilian Noninstitutionalized Population -- With health insurance coverage -- With private health insurance coverage
E098 Health Insurance Coverage -- Civilian Noninstitutionalized Population -- With health insurance coverage -- With public health coverage
E099 Health Insurance Coverage -- Civilian Noninstitutionalized Population -- No health insurance coverage
E100 Health Insurance Coverage -- Civilian Noninstitutionalized Population Under 18 years
E101 Health Insurance Coverage -- Civilian Noninstitutionalized Population Under 18 years -- No health insurance coverage
E102 Health Insurance Coverage -- Civilian Noninstitutionalized Population 18 to 64 years
E103 Health Insurance Coverage -- Civilian Noninstitutionalized Population 18 to 64 years -- In labor force
E104 Health Insurance Coverage -- Civilian Noninstitutionalized Population 18 to 64 years -- In labor force -- Employed
E105 Health Insurance Coverage -- Civilian Noninstitutionalized Population 18 to 64 years -- In labor force -- Employed -- With health insurance coverage
E106 Health Insurance Coverage -- Civilian Noninstitutionalized Population 18 to 64 years -- In labor force -- Employed -- With health insurance coverage -- With private health insurance
E107 Health Insurance Coverage -- Civilian Noninstitutionalized Population 18 to 64 years -- In labor force -- Employed -- With health insurance coverage -- With public coverage
E108 Health Insurance Coverage -- Civilian Noninstitutionalized Population 18 to 64 years -- In labor force -- Employed -- No health insurance coverage
E109 Health Insurance Coverage -- Civilian Noninstitutionalized Population 18 to 64 years -- In labor force -- Unemployed
E110 Health Insurance Coverage -- Civilian Noninstitutionalized Population 18 to 64 years -- In labor force -- Unemployed -- With health insurance coverage
E111 Health Insurance Coverage -- Civilian Noninstitutionalized Population 18 to 64 years -- In labor force -- Unemployed -- With health insurance coverage -- With private health insurance
E112 Health Insurance Coverage -- Civilian Noninstitutionalized Population 18 to 64 years -- In labor force -- Unemployed -- With health insurance coverage -- With public coverage
E113 Health Insurance Coverage -- Civilian Noninstitutionalized Population 18 to 64 years -- In labor force -- Unemployed -- No health insurance coverage
E114 Health Insurance Coverage -- Civilian Noninstitutionalized Population 18 to 64 years -- Not in labor force
E115 Health Insurance Coverage -- Civilian Noninstitutionalized Population 18 to 64 years -- Not In labor force -- With health insurance coverage
E116 Health Insurance Coverage -- Civilian Noninstitutionalized Population 18 to 64 years -- Not In labor force -- Employed -- With private health insurance
E117 Health Insurance Coverage -- Civilian Noninstitutionalized Population 18 to 64 years -- Not In labor force -- Employed -- With public coverage
E118 Health Insurance Coverage -- Civilian Noninstitutionalized Population 18 to 64 years -- Not In labor force -- No health insurance coverage
E119 Percent Families/people w/income past 12 mo below poverty level -- All families
E120 Percent Families/people w/income past 12 mo below poverty level -- All families -- With related children under 18 years
E121 Percent Families/people w/income past 12 mo below poverty level -- All families -- With related children under 5 years only
E122 Percent Families/people w/income past 12 mo below poverty level -- Married couple families
E123 Percent Families/people w/income past 12 mo below poverty level -- Married couple families -- With related children under 18 years
E124 Percent Families/people w/income past 12 mo below poverty level -- Married couple families -- With related children under 5 years only
E125 Percent Families/people w/income past 12 mo below poverty level -- Families with female householder, no husband present
E126 Percent Families/people w/income past 12 mo below poverty level -- Families with female householder, no husband present -- With related children under 18 years
E127 Percent Families/people w/income past 12 mo below poverty level -- Families with female householder, no husband present -- With related children under 5 years only
E128 Percent Families/people w/income past 12 mo below poverty level -- All people
H001 Total housing units
H002 Occupied housing units
H003 Vacant housing units
H004 Homeowner vacancy rate
H005 Rental vacancy rate
H006 Total housing units
H007 Units in Structure -- 1-unit, detached
H008 Units in Structure -- 1-unit, attached
H009 Units in Structure -- 2 units
H010 Units in Structure -- 3 or 4 units
H011 Units in Structure -- 5 to 9 units
H012 Units in Structure -- 10 to 19 units
H013 Units in Structure -- 20 or more units
H014 Units in Structure -- Mobile home
H015 Units in Structure -- Boat, RV, van, etc.
H016 Total housing units
H017 Total Housing Units -- Year Structure Built -- Built 2010 or later
H018 Total Housing Units -- Year Structure Built -- Built 2000 to 2009
H019 Total Housing Units -- Year Structure Built -- Built 1990 to 1999
H020 Total Housing Units -- Year Structure Built -- Built 1980 to 1989
H021 Total Housing Units -- Year Structure Built -- Built 1970 to 1979
H022 Total Housing Units -- Year Structure Built -- Built 1960 to 1969
H023 Total Housing Units -- Year Structure Built -- Built 1950 to 1959
H024 Total Housing Units -- Year Structure Built -- Built 1940 to 1949
H025 Total Housing Units -- Year Structure Built -- Built 1939 or earlier
H045 Occupied housing units -- Owner-occupied
H046 Occupied housing units -- Renter-occupied
H047 Occupied housing units -- Average household size of owner-occupied unit
H048 Occupied housing units -- Average household size of renter-occupied unit
H049 Occupied housing units
H050 Occupied housing units -- year householder moved into unit --Moved in 2010 or later
H051 Occupied housing units -- year householder moved into unit --Moved in 2000 to 2009
H052 Occupied housing units -- year householder moved into unit --Moved in 1990 to 2000
H053 Occupied housing units -- year householder moved into unit --Moved in 1980 to 1989
H054 Occupied housing units -- year householder moved into unit --Moved in 1970 to 1979
H055 Occupied housing units -- year householder moved into unit --Moved in 1969 or earlier
H076 Occupied housing units -- occupants per room -- 1.00 or less
H077 Occupied housing units -- occupants per room -- 1.01 to 1.50
H078 Occupied housing units -- occupants per room -- 1.51 or more
H079 Owner-occupied units
H080 Owner-occupied units -- Value -- Less than $50,000
H081 Owner-occupied units -- Value -- $50,000 to $99,999
H082 Owner-occupied units -- Value -- $100,000 to $149,999
H083 Owner-occupied units -- Value -- $150,000 to $199,999
H084 Owner-occupied units -- Value -- $200,000 to $299,999
H085 Owner-occupied units -- Value -- $300,000 to $499,999
H086 Owner-occupied units -- Value -- $500,000 to $999,999
H087 Owner-occupied units -- Value -- $1,000,000 or more
H088 Median (dollars)
H092 Housing units with a mortgage
H093 Housing units with a mortgage -- Selected Monthly Owner Costs -- Less than $300
H094 Housing units with a mortgage -- Selected Monthly Owner Costs -- $300 to $499
H095 Housing units with a mortgage -- Selected Monthly Owner Costs -- $500 to $699
H096 Housing units with a mortgage -- Selected Monthly Owner Costs -- $700 to $999
H097 Housing units with a mortgage -- Selected Monthly Owner Costs -- $1,000 to $1,499
H098 Housing units with a mortgage -- Selected Monthly Owner Costs -- $1,500 to $1,999
H099 Housing units with a mortgage -- Selected Monthly Owner Costs -- $2,000 or more
H100 Housing units with a mortgage -- Selected Monthly Owner Costs -- Median (dollars)
H124 Occupied units paying rent
H125 Occupied units paying rent -- gross rent -- Less than $200
H126 Occupied units paying rent -- gross rent -- $200 to $299
H127 Occupied units paying rent -- gross rent -- $300 to $499
H128 Occupied units paying rent -- gross rent -- $500 to $749
H129 Occupied units paying rent -- gross rent -- $750 to $999
H130 Occupied units paying rent -- gross rent -- $1,000 to $1,499
H131 Occupied units paying rent -- gross rent -- $1,500 or more
H132 Occupied units paying rent -- gross rent -- Median (dollars)


ProximityOne User Group
Join the ProximityOne User Group to keep up-to-date with new developments relating to metros and component geography decision-making information resources. Receive updates and access to tools and resources available only to members. Use this form to join the User Group.

Support Using these Resources
Learn more about accessing and using demographic-economic data and related analytical tools. Join us in a Data Analytics Lab session. There is no fee for these one-hour Web sessions. Each informal session is focused on a specific topic. The open structure also provides for Q&A and discussion of application issues of interest to participants.

Additional Information
ProximityOne develops geodemographic-economic data and analytical tools and helps organizations knit together and use diverse data in a decision-making and analytical framework. We develop custom demographic/economic estimates and projections, develop geographic and geocoded address files, and assist with impact and geospatial analyses. Wide-ranging organizations use our tools (software, data, methodologies) to analyze their own data integrated with other data. Follow ProximityOne on Twitter at www.twitter.com/proximityone. Contact us (888-364-7656) with questions about data covered in this section or to discuss custom estimates, projections or analyses for your areas of interest.


Copyright © . Proximity. All Rights Reserved.
Sitemap | Contact Us | News