
|
|
|
Census Tracts Main Census Tract Geography CVXE GIS Tools Data Resources Guide - projections to 2060 Related Sections - Situation & Outlook - Applications Gallery - States - Congressional District - School Districts - Counties - Cities/Places - Tracts/Neighborhoods - Block Groups - Census Blocks - Urban Areas Estimates-Projections - 2060 Demographic ... all county interactive table - 2030 Demographic-Economic - Single Year of Age GIS Thematic Mapping Visual Analysis Tools Ranking Tables National Scope Demographic Change 2000-2010 - States - Metros - Congressional District - School Districts - Counties - Cities/Places - Census Tracts |
Guide to Census Tract Geographic Demographic Economic Analysis
This document is a guide to use of Census Tract Demographic-Economic Patterns tools and data as described in Neighborhood Patterns GIS Projects section. The U.S. national scope state-by-state GIS project filesets are available at no fee to User Group members (see below in this section). Follow the download and installation directions for any state using instructions provided for each state via links listed on the Neighborhood Patterns Web page. This guide uses the Texas DMI Neighborhood Patterns GIS project and files for illustration. However, information provided here relates to any ProximityOne GIS project where a similar census tracts shapefile populated with subject matter as described below is used. This document extends on the "how to use" instructions provided on each state web page in the following ways. • viewing/analyzing characteristics of selected census tracts using spreadsheet/profile ... rows as subject matter (one column per tract) • viewing/analyzing characteristics of selected census tracts using spreadsheet/grid ... rows as geography (one row per tract) General Framework Steps and operations summarized here make use of the GIS project and CV XE GIS software. See User Guide for additional information about operations and nomenclature. Selected CV XE operations are reviewed below. To make effective use of this guide, it is recommended that you have installed a state DMI neighborhoods patterns GIS project (Texas suggested) and have that project open using CV XE GIS. Steps below summarize Texas GIS project installation. The related Texas DMI section includes these same steps and additional details. Visual Analysis of Neighborhood Patterns The graphic presented below (click for larger view) shows a thematic pattern map of Texas census tracts by median household income. This graphic shows the "start-up" view of the GIS project described in this section. We will review how, in just a few steps, how you can develop maps like this one for interactive use; perform geographic drill-down and navigation; label tracts and other geography; change attributes of patterns and/or variables used in thematic maps; add other layers; and examine the data in tabular form. 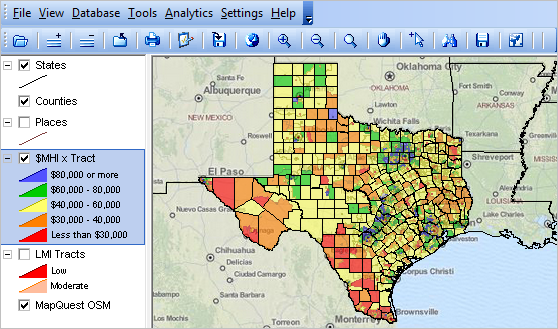
Steps to Develop the Above Map (requires Windows computer with Internet connection) I-1. Install the ProximityOne CV XE GIS ... run the CV XE GIS installer ... take all defaults during installation I-2. Download the Texas Neighborhoods GIS Project zip file. ... requires ProximityOne User Group ID (join now, no fee) I-3. Expand the zip file to the folder c:\dmi. I-4. Initial start-up. ... after completing the above steps and with CV XE running (use desktop icon) ... use File>Open>Dialog to open the project file named c:\dmi\tx1.gis ... the map view shown above should appear. Tracts Shapefile Related to Layer The following view (click graphic for larger view) highlights the path/name of the shapefile being used for a tracts layer.  In this example, the path/name of the shapefile is "c:\dmi\gz_2010_140_48.shp". The shapefile named gz_2010_140_48.shp is located in folder c:\dmi. The shapefile referenced is comprised of 4 files: • gz_2010_140_48.shp (geometry - latitude-longitude values of the tract boundary vertices) • gz_2010_140_48.dbf (dbase file containing a row/record for each tract populated with attributes) • gz_2010_140_48.shx (index file associating the dbf and shp files) • gz_2010_140_48.prj (geographic projection) Develop a similar view for a tracts shapefile in any open CV XE GIS project by dbl-clicking the layer name in the legend panel at left of map to start the layer editor. When the layer editor starts (shown in graphic above), click the layer tab. CV XE Selected Operations See User Guide for additional information. See more about GIS. The start-up Neighborhood Patterns GIS is our starting place for this section. That GIS project can be greatly expanded to meet your specific needs/interests. Develop a vision for what you want to show or analyze. A simple example would be to zoom to view of a particular county or city, highlight those boundaries, possibly label with an item of interest (e.g. educational attainment) and save a graphic of the new view; add the graphic to a web page or document where it might be discussed with related text. Selected CV XE operations are reviewed below. A-1. Map View Navigation
See summary of navigation operations
If the view becomes disoriented, close CV XE, restart, re-open as in installation step I-4 above. A-2. Map View Composition -- selecting layers & setting layer attributes
click layer checkbox on in legend panel to make the layer visible.
change layer attributes -- use Layer editor to set layer attributes -- label tracts with tract code (yellow background). slide layer up or down: click on a layer in legend panel, hold down mouse button & drag up or down. A-3. View Profile for a Geographic Object -- use select/identify tool -- scroll section
use Identify tool to show mini-profile of a tract attributes.
Navigate to zoom-in view of Houston area. Click Identify/Select tool (pointer) from toolbar above map. Click on tract shown at pointer in tract below. Mini-profile appears. 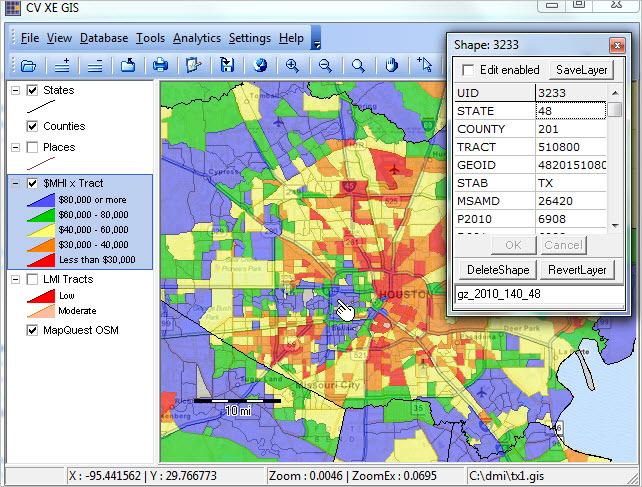 Click graphic for larger view. When the identify tool is used to click on a geographic object, the mini-profile is displayed and the content of that grid is copied to clipboard. Start Excel and Ctrl-V (paste) into cell A1. The following view appears. The data for this tract are now available for Excel operations; optionally add more tract columns. 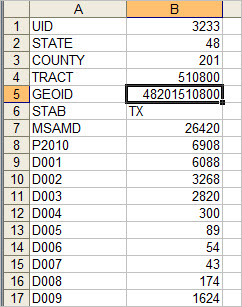 By inserting a column 2 then copy/pasting the items names (scroll section D-2 below), the rows show the descriptive name. Copy from scroll section below starting with "UID" and paste into new column 2 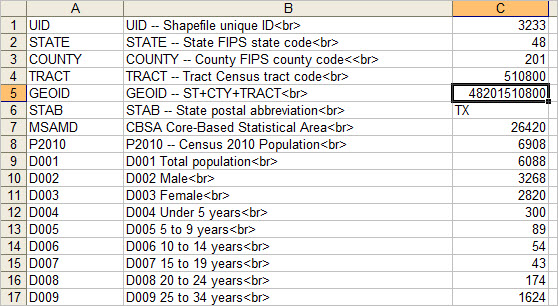 A-4. View Layer Data as Table/Spreadsheet
use Database>dBrowse to view/query tracts in tabular manner.
To view the tracts dbase file, use Database>dBrowse and open the file "c:\dmi\gz_2010_140_48.dbf" (no quotes). The tracts dbase file opens in the grid as shown below. Caution: any changes made to cell values will immediately take place and are permanent.  Click graphic for larger view. Dataset Fields The scroll section below shows attributes/fields available for each census tract/neighborhood. Most items are derived from four datasets: General Demographics (D items), Social Characteristics (S items), Economic Characteristics, (E items) and Housing Characteristics (H items). A few items (HDMA) have been derived from the HMDA "Census 2013" dataset and integrated into the shapefile used in the project. Several hundred additional items can be made available. Item HMDAS1 is the Tract Income Level and determines the census tract HMDA LMI designation. The values that this field can take on are shown as codes 0 .. 4. Using this classification there are 5,588 tracts having a HMDAS1 value of 1 or low income. Use vertical scroll bar at right to scroll and view all fields. D-1. Data Items Included in Tracts DMI Layer/Shapefile -- scroll section Click a link to navigate to those items in the scroll section. General Demographics ... Social Characteristics ... Economic Characteristics ... Housing Characteristics ... HMDA Items
Codes
P2010 Total population (Census 2010; remaining items ACS 2011 5 year estimates) AGE AND GENDER D001 Total population D002 Male D003 Female D004 Under 5 years D005 5 to 9 years D006 10 to 14 years D007 15 to 19 years D008 20 to 24 years D009 25 to 34 years D010 35 to 44 years D011 45 to 54 years D012 55 to 59 years D013 60 to 64 years D014 65 to 74 years D015 75 to 84 years D016 85 years and over D017 Median age (years) D018 18 years and over D019 21 years and over D020 62 years and over D021 65 years and over D022 18 years and over D023 Male D024 Female D025 65 years and over D026 Male D027 Female RACE D028 Total population D029 One race D030 Two or more races D031 One race D032 White D033 Black or African American D034 American Indian and Alaska Native D039 Asian D047 Native Hawaiian and Other Pacific Islander D052 Some other race D053 Two or more races D066 Hispanic or Latino (of any race) D067 Mexican D068 Puerto Rican D069 Cuban D070 Other Hispanic or Latino Social Characteristics Items HOUSEHOLDS BY TYPE S001 Total households S002 Family households (families) S010 Nonfamily households S015 Average household size S016 Average family size RELATIONSHIP S017 Population in households SCHOOL ENROLLMENT S052 Population 3 years and over enrolled in school S053 Nursery school, preschool S054 Kindergarten S055 Elementary school (grades 1-8) S056 High school (grades 9-12) S057 College or graduate school EDUCATIONAL ATTAINMENT S058 Population 25 years and over S059 Less than 9th grade S060 9th to 12th grade, no diploma S061 High school graduate (includes equivalency) S062 Some college, no degree S063 Associate's degree S064 Bachelor's degree S065 Graduate or professional degree S066 Percent high school graduate or higher S067 Percent bachelor's degree or higher RESIDENCE 1 YEAR AGO S078 Population 1 year and over S079 Same house S080 Different house in the U.S. S081 Same county S082 Different county S083 Same state S084 Different state S085 Abroad LANGUAGE SPOKEN AT HOME S110 Population 5 years and over S111 English only S112 Language other than English S113 Speak English less than "very well" S114 Spanish S115 Speak English less than "very well" Economic Characteristics Items EMPLOYMENT STATUS E001 Population 16 years and over E002 In labor force E003 Civilian labor force E004 Employed E005 Unemployed E006 Armed Forces E007 Not in labor force E008 Civilian labor force E009 Percent Unemployed INDUSTRY Civilian employed population 16 years and over E033 Agriculture, forestry, fishing and hunting, and mining E034 Construction E035 Manufacturing E036 Wholesale trade E037 Retail trade E038 Transportation and warehousing, and utilities E039 Information E040 Finance and insurance, and real estate and rental and leasing E041 Professional, scientific, and management, and administrative and waste management services E042 Educational services, and health care and social assistance E043 Arts, entertainment, and recreation, and accommodation and food services E044 Other services, except public administration E045 Public administration INCOME AND BENEFITS (IN 2010 INFLATION-ADJUSTED DOLLARS) Total households E052 Less than $10,000 E053 $10,000 to $14,999 E054 $15,000 to $24,999 E055 $25,000 to $34,999 E056 $35,000 to $49,999 E057 $50,000 to $74,999 E058 $75,000 to $99,999 E059 $100,000 to $149,999 E060 $150,000 to $199,999 E061 $200,000 or more E062 Median household income (dollars) E063 Mean household income (dollars) E075 Families E076 Less than $10,000 E077 $10,000 to $14,999 E078 $15,000 to $24,999 E079 $25,000 to $34,999 E080 $35,000 to $49,999 E081 $50,000 to $74,999 E082 $75,000 to $99,999 E083 $100,000 to $149,999 E084 $150,000 to $199,999 E085 $200,000 or more E086 Median family income (dollars) E087 Mean family income (dollars) PERCENT FAMILIES & PEOPLE W/INCOME PAST 12 MONTHS BELOW POVERTY LEVEL E119 All families E120 With related children under 18 years E121 With related children under 5 years only E122 Married couple families E123 With related children under 18 years E124 With related children under 5 years only E125 Families with female householder, no husband present E126 With related children under 18 years E127 With related children under 5 years only E128 All people Housing Characteristics Items HOUSING OCCUPANCY H001 Total housing units H002 Occupied housing units H003 Vacant housing units H004 Homeowner vacancy rate H005 Rental vacancy rate UNITS IN STRUCTURE H006 Total housing units H007 1-unit, detached H008 1-unit, attached H009 2 units H010 3 or 4 units H011 5 to 9 units H012 10 to 19 units H013 20 or more units H014 Mobile home H015 Boat, RV, van, etc. YEAR STRUCTURE BUILT H016 Total housing units H017 Built 2005 or later H018 Built 2000 to 2004 H019 Built 1990 to 1999 H020 Built 1980 to 1989 H021 Built 1970 to 1979 H022 Built 1960 to 1969 H023 Built 1950 to 1959 H024 Built 1940 to 1949 H025 Built 1939 or earlier HOUSING TENURE Occupied housing units H045 Owner-occupied H046 Renter-occupied H047 Average household size of owner-occupied unit H048 Average household size of renter-occupied unit YEAR HOUSEHOLDER MOVED INTO UNIT H049 Occupied housing units H050 Moved in 2005 or later H051 Moved in 2000 to 2004 H052 Moved in 1990 to 1999 H053 Moved in 1980 to 1989 H054 Moved in 1970 to 1979 H055 Moved in 1969 or earlier OCCUPANTS PER ROOM Occupied housing units H076 1.00 or less H077 1.01 to 1.50 H078 1.51 or more VALUE H079 Owner-occupied units H080 Less than $50,000 H081 $50,000 to $99,999 H082 $100,000 to $149,999 H083 $150,000 to $199,999 H084 $200,000 to $299,999 H085 $300,000 to $499,999 H086 $500,000 to $999,999 H087 $1,000,000 or more H088 Median (dollars) SELECTED MONTHLY OWNER COSTS (SMOC) H092 Housing units with a mortgage H093 Less than $300 H094 $300 to $499 H095 $500 to $699 H096 $700 to $999 H097 $1,000 to $1,499 &nbsnbsp; H098 $1,500 to $1,999 H099 $2,000 or more H100 Median (dollars) GROSS RENT H124 Occupied units paying rent H125 Less than $200 H126 $200 to $299 H127 $300 to $499 H128 $500 to $749 H129 $750 to $999 H130 $1,000 to $1,499 H131 $1,500 or more H132 Median (dollars) HMDA Sourced Items
D-2. Dataset Field Descriptions -- scroll section Similar to above list but structured with one row per item/field. This item/description list can be used is applications as described in A-3 above.
UID -- Shapefile unique ID
STATE -- State FIPS state code COUNTY -- County FIPS county code< TRACT -- Tract Census tract code GEOID -- ST+CTY+TRACT STAB -- State postal abbreviation CBSA Core-Based Statistical Area P2010 -- Census 2010 Population D001 Total population D002 Male D003 Female D004 Under 5 years D005 5 to 9 years D006 10 to 14 years D007 15 to 19 years D008 20 to 24 years D009 25 to 34 years D010 35 to 44 years D011 45 to 54 years D012 55 to 59 years D013 60 to 64 years D014 65 to 74 years D015 75 to 84 years D016 85 years and over D017 Median age (years) D018 18 years and over D019 21 years and over D020 62 years and over D021 65 years and over D022 ; 18 years and over D023 Male -- 18 years and over D024 Female -- 18 years and over D025 65 years and over D026 Male -- 65 years and over D027 Female -- 65 years and over D028 Total population D029 One race D030 Two or more races D031 One race D032 One race -- White D033 One race -- Black or African American D034 One race -- American Indian and Alaska Native D039 One race -- Asian D047 One race -- Native Hawaiian and Other Pacific Islander D052 One race -- Some other race D053 Two or more races D066 Hispanic or Latino (of any race) D067 Hispanic or Latino (of any race) -- Mexican D068 Hispanic or Latino (of any race) -- Puerto Rican D069 Hispanic or Latino (of any race) -- Cuban D070 Hispanic or Latino (of any race) -- Other Hispanic or Latino S001 Total households S002 Family households (families) S010 Nonfamily households S015 Average household size S016 Average family size S017 Population in households S052 Population 3 years and over enrolled in school S053 School Enrollment -- Nursery school, preschool S054 School Enrollment -- Kindergarten S055 School Enrollment -- Elementary school (grades 1-8) S056 School Enrollment -- High school (grades 9-12) S057 School Enrollment -- College or graduate school S058 Population 25 years and over S059 Educational Attainment -- Less than 9th grade S060 Educational Attainment -- 9th to 12th grade, no diploma S061 Educational Attainment -- High school graduate (includes equivalency) S062 Educational Attainment -- Some college, no degree S063 Educational Attainment -- Associate degree S064 Educational Attainment -- Bachelor degree S065 Educational Attainment -- Graduate or professional degree S066 Educational Attainment -- Percent high school graduate or higher S067 Educational Attainment -- Percent bachelor's degree or higher S078 Population 1 year and over S079 Residence 1 year ago -- population 1 year and over -- Same house S080 Residence 1 year ago -- population 1 year and over -- Different house in the U.S. S081 Residence 1 year ago -- population 1 year and over -- Same county S082 Residence 1 year ago -- population 1 year and over -- Different county S083 Residence 1 year ago -- population 1 year and over -- Different county -- Same state S084 Residence 1 year ago -- population 1 year and over -- Different county -- Different state S085 Residence 1 year ago -- population 1 year and over -- Abroad S110 Population 5 years and over S111 Language Spoken at Home -- Population 5 years and over -- English only S112 Language Spoken at Home -- Population 5 years and over -- Language other than English S113 Language Spoken at Home -- Population 5 years and over -- Language other than English -- Speak English less than "very well" S114 Language Spoken at Home -- Population 5 years and over -- Language other than English -- Speak English less than "very well" -- Spanish S115 Language Spoken at Home -- Population 5 years and over -- Language other than English -- Speak English less than "very well" -- Spanish -- Speak English less than "very well" E001 Population 16 years and over E002 In labor force E003 In labor force -- Civilian labor force E004 In labor force -- Civilian labor force -- Employed E005 In labor force -- Civilian labor force -- Unemployed E006 In labor force -- Armed Forces E007 Not in labor force E008 Civilian labor force E009 Civilian labor force -- Percent Unemployed E033 Civilian employed population 16 years+ -- industry of employment -- Agriculture, forestry, fishing and hunting, and mining E034 Civilian employed population 16 years+ -- industry of employment -- Construction E035 Civilian employed population 16 years+ -- industry of employment -- Manufacturing E036 Civilian employed population 16 years+ -- industry of employment -- Wholesale trade E037 Civilian employed population 16 years+ -- industry of employment -- Retail trade E038 Civilian employed population 16 years+ -- industry of employment -- Transportation and warehousing, and utilities E039 Civilian employed population 16 years+ -- industry of employment -- Information E040 Civilian employed population 16 years+ -- industry of employment -- Finance and insurance, and real estate and rental and leasing E041 Civilian employed population 16 years+ -- industry of employment -- Professional, scientific, and management, and administrative and waste management services E042 Civilian employed population 16 years+ -- industry of employment -- Educational services, and health care and social assistance E043 Civilian employed population 16 years+ -- industry of employment -- Arts, entertainment, and recreation, and accommodation and food services E044 Civilian employed population 16 years+ -- industry of employment -- Other services, except public administration E045 Civilian employed population 16 years+ -- industry of employment -- Public administration E051 Total households E052 Households Income and Benefits -- Less than $10,000 E053 Households Income and Benefits -- $10,000 to $14,999 E054 Households Income and Benefits -- $15,000 to $24,999 E055 Households Income and Benefits -- $25,000 to $34,999 E056 Households Income and Benefits -- $35,000 to $49,999 E057 Households Income and Benefits -- $50,000 to $74,999 E058 Households Income and Benefits -- $75,000 to $99,999 E059 Households Income and Benefits -- $100,000 to $149,999 E060 Households Income and Benefits -- $150,000 to $199,999 E061 Households Income and Benefits -- $200,000 or more E062 Households Income and Benefits -- Median household income (dollars) E063 Households Income and Benefits -- Mean household income (dollars) E075 Families E076 Families Income and Benefits -- Less than $10,000 E077 Families Income and Benefits -- $10,000 to $14,999 E078 Families Income and Benefits -- $15,000 to $24,999 E079 Families Income and Benefits -- $25,000 to $34,999 E080 Families Income and Benefits -- $35,000 to $49,999 E081 Families Income and Benefits -- $50,000 to $74,999 E082 Families Income and Benefits -- $75,000 to $99,999 E083 Families Income and Benefits -- $100,000 to $149,999 E084 Families Income and Benefits -- $150,000 to $199,999 E085 Families Income and Benefits -- $200,000 or more E086 Families Income and Benefits -- Median family income (dollars) E087 Families Income and Benefits -- Mean family income (dollars) E119 Percent Families/people w/income past 12 mo below poverty level -- All families E120 Percent Families/people w/income past 12 mo below poverty level -- All families -- With related children under 18 years E121 Percent Families/people w/income past 12 mo below poverty level -- All families -- With related children under 5 years only E122 Percent Families/people w/income past 12 mo below poverty level -- Married couple families E123 Percent Families/people w/income past 12 mo below poverty level -- Married couple families -- With related children under 18 years E124 Percent Families/people w/income past 12 mo below poverty level -- Married couple families -- With related children under 5 years only E125 Percent Families/people w/income past 12 mo below poverty level -- Families with female householder, no husband present E126 Percent Families/people w/income past 12 mo below poverty level -- Families with female householder, no husband present -- With related children under 18 years E127 Percent Families/people w/income past 12 mo below poverty level -- Families with female householder, no husband present -- With related children under 5 years only E128 Percent Families/people w/income past 12 mo below poverty level -- All people H001 Total housing units H002 Occupied housing units H003 Vacant housing units H004 Homeowner vacancy rate H005 Rental vacancy rate H006 Total housing units H007 Units in Structure -- 1-unit, detached H008 Units in Structure -- 1-unit, attached H009 Units in Structure -- 2 units H010 Units in Structure -- 3 or 4 units H011 Units in Structure -- 5 to 9 units H012 Units in Structure -- 10 to 19 units H013 Units in Structure -- 20 or more units H014 Units in Structure -- Mobile home H015 Units in Structure -- Boat, RV, van, etc. H016 Total housing units H017 Total Housing Units -- Year Structure Built -- Built 2005 or later H018 Total Housing Units -- Year Structure Built -- Built 2000 to 2004 H019 Total Housing Units -- Year Structure Built -- Built 1990 to 1999 H020 Total Housing Units -- Year Structure Built -- Built 1980 to 1989 H021 Total Housing Units -- Year Structure Built -- Built 1970 to 1979 H022 Total Housing Units -- Year Structure Built -- Built 1960 to 1969 H023 Total Housing Units -- Year Structure Built -- Built 1950 to 1959 H024 Total Housing Units -- Year Structure Built -- Built 1940 to 1949 H025 Total Housing Units -- Year Structure Built -- Built 1939 or earlier H045 Occupied housing units -- Owner-occupied H046 Occupied housing units -- Renter-occupied H047 Occupied housing units -- Average household size of owner-occupied unit H048 Occupied housing units -- Average household size of renter-occupied unit H050 Occupied housing units H051 Occupied housing units -- year householder moved into unit --Moved in 2000 or later H052 Occupied housing units -- year householder moved into unit --Moved in 1990 to 2000 H053 Occupied housing units -- year householder moved into unit --Moved in 1980 to 1989 H054 Occupied housing units -- year householder moved into unit --Moved in 1970 to 1979 H055 Occupied housing units -- year householder moved into unit --Moved in 1969 or earlier H076 Occupied housing units -- occupants per room -- 1.00 or less H077 Occupied housing units -- occupants per room -- 1.01 to 1.50 H078 Occupied housing units -- occupants per room -- 1.51 or more H080 Owner-occupied units -- Value -- Less than $50,000 H081 Owner-occupied units -- Value -- $50,000 to $99,999 H082 Owner-occupied units -- Value -- $100,000 to $149,999 H083 Owner-occupied units -- Value -- $150,000 to $199,999 H084 Owner-occupied units -- Value -- $200,000 to $299,999 H085 Owner-occupied units -- Value -- $300,000 to $499,999 H086 Owner-occupied units -- Value -- $500,000 to $999,999 H087 Owner-occupied units -- Value -- $1,000,000 or more H088 Median (dollars) H092 Housing units with a mortgage H093 Housing units with a mortgage -- Selected Monthly Owner Costs -- Less than $300 H094 Housing units with a mortgage -- Selected Monthly Owner Costs -- $300 to $499 H095 Housing units with a mortgage -- Selected Monthly Owner Costs -- $500 to $699 H096 Housing units with a mortgage -- Selected Monthly Owner Costs -- $700 to $999 H097 Housing units with a mortgage -- Selected Monthly Owner Costs -- $1,000 to $1,499 H098 Housing units with a mortgage -- Selected Monthly Owner Costs -- $1,500 to $1,999 H099 Housing units with a mortgage -- Selected Monthly Owner Costs -- $2,000 or more H100 Housing units with a mortgage -- Selected Monthly Owner Costs -- Median (dollars) H124 Occupied units paying rent H125 Occupied units paying rent -- gross rent -- Less than $200 H126 Occupied units paying rent -- gross rent -- $200 to $299 H127 Occupied units paying rent -- gross rent -- $300 to $499 H128 Occupied units paying rent -- gross rent -- $500 to $749 H129 Occupied units paying rent -- gross rent -- $750 to $999 H130 Occupied units paying rent -- gross rent -- $1,000 to $1,499 H131 Occupied units paying rent -- gross rent -- $1,500 or more H132 Occupied units paying rent -- gross rent -- Median (dollars) Terms of Use. Resources made available via this Web page are proprietary to ProximityOne. The resources may be used in any manner without further authorization except that none of the resources may be redistributed and none of the resources may be used with other software. Links to this page are encouraged as well as use of the data in stories and analyses. Any use of these resources is solely at the discretion of the user. There is no warranty or guarantee of any type. Support Using these Resources Learn more about demographic economic data and related analytical tools. Join us in a Decision-Making Information Web session. There is no fee for these one-hour Web sessions. Each informal session is focused on a specific topic. The open structure also provides for Q&A and discussion of application issues of interest to participants. ProximityOne User Group Join the ProximityOne User Group to keep up-to-date with new developments relating to geographic-demographic-economic decision-making information resources. Receive updates and access to tools and resources available only to members. Use this form to join the User Group. There is no fee. Additional Information ProximityOne develops geographic-demographic-economic data and analytical tools and helps organizations knit together and use diverse data in a decision-making and analytical framework. We develop custom demographic/economic estimates and projections, develop geographic and geocoded address files, and assist with impact and geospatial analyses. Wide-ranging organizations use our tools (software, data, methodologies) to analyze their own data integrated with other data. Follow ProximityOne on Twitter at www.twitter.com/proximityone. Contact ProximityOne (888-364-7656) with questions about data covered in this section or to discuss custom estimates, projections or analyses for your areas of interest. |
|
|