
|
|
|
School Districts by State 1952-2012 ... changing patterns during the past 60 years
While the total number of school districts has remained about the same in recent years, the total number of districts in 1952 was 69,765 compared to 14,176 in 2012. There were more than 109,000 school districts in 1942. Use the interactive ranking table below to see how the number of school districts have changed by state and type since 1952. These data are presented in 5-year intervals and are based on the Census Bureau quinquennial Census of Governments. Updates. Local Education Agencies by Type & State, 2014-15 school year Of the 14,176 public school systems in the United States in 2012, only the 12,884 that are independent school districts are included in the count of governments. The other 1,292 "dependent" public school systems are classified as agencies of other governments-state, county, municipal, or town or township-and are not counted as separate governments. Use ranking table to view 2012 school districts by state in ascending/descending order. See example and details. Because of the variety of state legislative provisions for the administration and operation of public schools, great diversity exists in school organization throughout the United States. The number of states providing for public schools solely through independent school districts numbered 31 in 2012 (same for 2007). This independent district arrangement, which prevails in most parts of the country, is almost universal in the West. A mixed situation occurs in 15 states, with the public schools that provide elementary and secondary education operated in some areas by independent school districts and elsewhere by a county, municipal, town or township, or state government. In the District of Columbia and in four states (Alaska, Hawaii, Maryland, and North Carolina), there are no independent school districts; all public schools in those jurisdictions are administered by systems that are agencies of the county, municipal, or state government. Alaska, Hawaii, Maine, Massachusetts, Michigan, New Jersey, Rhode Island, and Texas each have at least one state-dependent public school system. School Districts by State 1952-2012 -- Interactive Ranking Table Click ShowAll button between Find/Queries. See ranking table usage notes below ranking table. See related ranking tables -- http://proximityone.com/rankingtables.htm. Using the Ranking Table • Click on a column header to sort on that column; click column header again to sort in other direction. • Click ShowAll button to show all tabulation areas and restore full set of data view. View Patterns by State. To view patterns in a selected state, 1) click ShowAll, 2) choose the state using the dropdown selection box below the table, 3) click/dbl-click the year header column to organize view in ascending order by year. Example for Missouri school districts, 1952-2012, shown below. The following view is a graphic illustrating a table view. Use interactive table above for a dynamic ranking and to scroll. 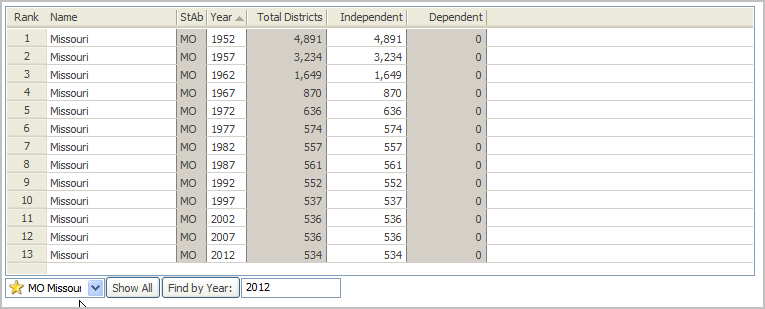
View Patterns for a Selected Year. To view patterns for a selected year, 1) click ShowAll, 2) set the Find by Year query box to 2012 (default) and click the Find by Year button below the table, 3) click/dbl-click the year header column to organize view in ascending/descending order. Example for 2012, ranked in descending order, shown below. The following view is a graphic illustrating a table view. Use interactive table above for a dynamic ranking and to scroll. 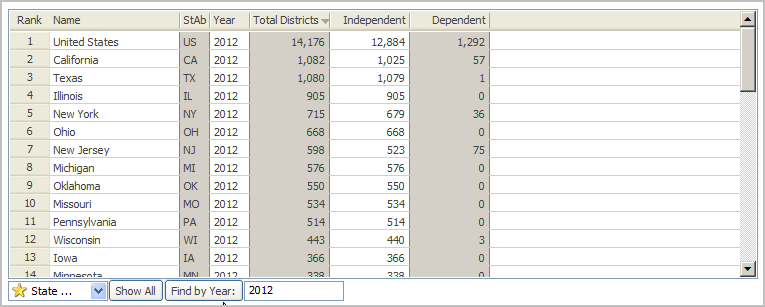
ProximityOne User Group Join the ProximityOne User Group to keep up-to-date with new developments relating to geographic, demographic, economic and business data. Receive updates and access to tools and resources available only to members. Use this form to join the User Group. . Support Using these Resources Learn more about accessing and using demographic-economic data and related analytical tools. Join us in a Data Analytics Lab session. There is no fee for these one-hour Web sessions. Each informal session is focused on a specific topic. The open structure also provides for Q&A and discussion of application issues of interest to participants. Additional Information ProximityOne develops geodemographic-economic data and analytical tools and helps organizations knit together and use diverse data in a decision-making and analytical framework. We develop custom demographic/economic estimates and projections, develop geographic and geocoded address files, and assist with impact and geospatial analyses. Wide-ranging organizations use our tools (software, data, methodologies) to analyze their own data integrated with other data. Follow ProximityOne on Twitter at www.twitter.com/proximityone. Contact us (888-364-7656) with questions about data covered in this section or to discuss custom estimates, projections or analyses for your areas of interest. |
|
|