
|
|
|
Real Gross Domestic Product by State and Area -- tools to access and analyze GDP patterns and trends
Gross Domestic Product (GDP) is a comprehensive measure of U.S. economic activity. This section provides access to annual GDP estimates for the period 2010 through 2015 and tools to analyze these data. The 2015 data are the latest estimates as of June 2016 (about these data). This section provides data and tools focused on the U.S. and states. In September 2016, this section updates to include the new 2015 estimates of metropolitan area GDP and revised historical updates. Follow the Data Analytics Blog to receive updates. Patterns of Per Capita Real GDP & Percent Change by State The following graphic shows patterns of the 2015 per capita real GDP by state. The color patterns/intervals are shown in the inset legend. In the larger view (click graphic), states are labeled with 2015 per capita real GDP (white label) and percent change in per capita real GDP, 2010-2015. Click graphic for larger view. Expand browser to full window for best quality view. The larger view shows a mini-profile for Texas. Use the GIS tools described below to develop thematic pattern map using any combination of these items from 2000 forward. 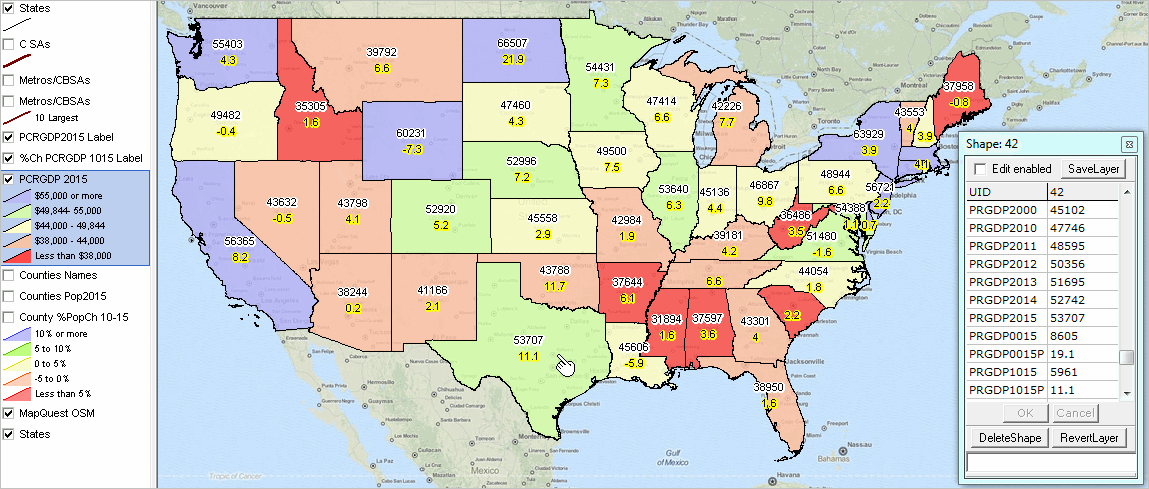 .. view developed using the CV XE GIS software. .. click map for larger view and details. Importance GDP is an important part of planning, management and decision-making in the private and public sectors. It is watched closely by all stakeholders as to how the economy is trending. By adjusting current dollar GDP to constant dollar GDP, we can better examine the trends and patterns by removing inflation from the measures. By examining GDP at the metro and sub-state area, businesses and policy-makers can better determine GDP patterns on a regional basis. Regional analysis of GDP is very important as magnitude and change vary widely. By examining the size and trends of regional real GDP on a per capita basis, we are better able to examine patterns and trends at the individual level. Modeling, Projections & Access/Analysis/Interpretive Tools GDP is an important part of the ProximityOne Regional Demographic-Economic Modeling System (RDEMS). The RDEMS model specifies cause and effect relationships with GDP and GDP components and other data to develop current estimates and projections. Use these tools to access/analyze GDP characteristics and patterns: • interactive table - below in this section • analyzing patterns using GIS resources - below in this section • RDEMS database access .. illustrative example of GDP patterns in context with other measures .. Texas briefing notes (see notes "Texas per capita real GDP" on that page) .. Access briefing notes for any state Interactive Table Use the interactive table below to examine per capita real GDP by state in context of other states and the U.S. This table expands to include metros in September 2016. The content of the table also expands to include GDP sectors and components Per Capita Real Gross Domestic Product by State & Area; 2000-2015 -- interactive table Use mouse-over on header column to view extended item/column name. Click ShowAll button between Find/Queries. See usage notes below table. Related ranking tables: http://proximityone.com/rankingtables.htm. Usage Notes Use mouse-over on header column to view extended item/column name. Click ShowAll button to reset table. Column Descriptions
- AreaName
- State - GeoID - Region, - Per capita real GDP 2000 - Per capita real GDP 2010 - Per capita real GDP2011 - Per capita real GDP 2012 - Per capita real GDP 2013 - Per capita real GDP 2014 - Per capita real GDP 2015 - Per capita real GDP Change 2000-15 - Per capita real GDP %Change 2000-15 - Per capita real GDP Change 2010-15 - Per capita real GDP &Change 2010-15 Analyzing GDP using GIS Resources (requires Windows computer with Internet connection) 1. Install the ProximityOne CV XE GIS ... run the CV XE GIS installer ... take all defaults during installation 2. Download the GDP GIS project fileset ... requires ProximityOne User Group ID (join now) ... unzip GDP GIS project files to local folder c:\gdp 3. Open the c:\gdp\us1gdp.gis project ... after completing the above steps, click File>Open>Dialog ... open the file named c:\gdp\us1gdp.gis 4. Done. The start-up view is shown at top of this section. About the Data GDP by state is the state counterpart of the U.S. Gross Domestic Product (GDP), the most comprehensive measure of U.S. economic activity. GDP by state is derived as the sum of the GDP originating in all the industries in a state. The Bureau of Economic Analysis develops estimates of GDP but does not develop projections of GDP or assess impact of changing GDP beyond what the estimates are telling us. The statistics of real GDP by state are prepared in chained (2009) dollars. Real GDP by state is an inflation-adjusted measure of each state's gross product that is based on national prices for the goods and services produced within that state. The statistics of real GDP by state and quantity indexes with a reference year of 2009 were derived by applying national chain-type price indexes to the current-dollar values of GDP by state for the 21 NAICS-based industry sectors. An industry's GDP by state, or its value added, is calculated as the sum of incomes earned by labor and capital and the costs incurred in the production of goods and services. It includes the wages and salaries that workers earn, the income earned by individual or joint entrepreneurs as well as by corporations, and business taxes such as sales, property, and Federal excise taxes—that count as a business expense. GDP is calculated as the sum of what consumers, businesses, and government spend on final goods and services, plus investment and net foreign trade. In concept, incomes earned should equal what is spent, but due to different data sources, the measurement of income earned (gross domestic income), does not always equal the measurement of what is spent (GDP). The difference is referred to as the "statistical discrepancy." GDP by state for the U.S. differs from the GDP in the national income and product accounts (NIPAs) and thus from the Industry Economic Accounts' GDP by industry, because GDP by state for the U.S. excludes federal military and civilian activity located overseas, which cannot be attributed to a particular state. Support Using these Resources Learn more about demographic economic data and related analytical tools. Join us in a Data Analytics Lab session. There is no fee for these Web sessions. Each informal session is focused on a specific topic. The open structure also provides for Q&A and discussion of application issues of interest to participants. ProximityOne User Group Join the ProximityOne User Group to keep up-to-date with new developments relating to geographic-demographic-economic decision-making information resources. Receive updates and access to tools and resources available only to members. Use this form to join the User Group. Additional Information ProximityOne develops geographic-demographic-economic data and analytical tools and helps organizations knit together and use diverse data in a decision-making and analytical framework. We develop custom demographic/economic estimates and projections, develop geographic and geocoded address files, and assist with impact and geospatial analyses. Wide-ranging organizations use our software, data and methodologies to analyze their own data integrated with other data. Follow ProximityOne on Twitter at www.twitter.com/proximityone. Contact ProximityOne (888-364-7656) with questions about data covered in this section or to discuss custom estimates, projections or analyses for your areas of interest. |
|
|