
|
|
Situation & Outlook CV XE GIS Tools Data Resources Guide - projections to 2060 Related Sections - Applications Gallery - States - Congressional District - School Districts - Counties - Cities/Places - Tracts/Neighborhoods - Block Groups - Census Blocks - Urban Areas Demographic-Economic Estimates-Projections GIS Thematic Mapping Visual Analysis Tools Ranking Tables National Scope Demographic Change 2000-2010 - States - Metros - Congressional District - School Districts - Counties - Cities/Places - Census Tracts |
2014 Census Tract Demographic Estimates
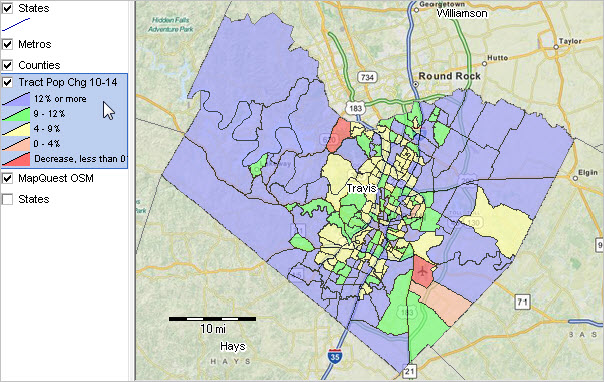
Census tract demographics are used in wide-ranging public and private sector applications to examine patterns and characteristics of sub-county areas. Data from Census 2000 and Census 2010 can be used to analyze trade/market areas, neighborhoods and other small area study areas. But what about trends since 2010? Annual data from the American Community Survey (ACS) 5-year estimates are available by census tract. See this example showing ACS 2012 and 2013 5-year estimates by census tract. These data are not for the years 2013 and 2014 but estimates for ACS survey respondents for the 5 year period 2008-2012 (ACS 2012) and 5-year period 2009-2013 (ACS 2013). There are no current annual estimates of census tract demographics available from the Census Bureau. This section provides access to 2014 census tract population estimates developed by ProximityOne. These estimates are part of the ProximityOne Situation & Outlook demographic-economic estimates and projections. Get Census Tract Code Based on Address Use the Census Tract API to locate a census tract code based on address. Key in an address, click Find button and view profile for census tract including census tract code. Terms of Use Data in the table below may be used for any purpose provided that the data are not redistributed and the source of the data is attributed to ProximityOne with a link to this Web page (http://proximityone.com/census_tract_demographics.htm). There is no warranty of any type regarding any aspect of these data. The user of these data is solely responsible for any use. Population, 2010-2014 Percent Change; Travis County, TX  -- view developed using CV XE GIS; click graphic for larger view Census Tract Population Characteristics: 2010-2014 -- Interactive Table Click column header to sort; click again to sort other direction. See usage notes below table. See related Ranking Tables Main Page Usage Notes The present version of the above table includes all tracts in selected counties: .. Miami-Dade, FL, Cook County, IL (Chicago), Boone County, MO, Harris County, TX (Houston), Travis County, TX (Austin) • Get census tract code based on address. - census tract codes are 11-character codes with no lead zeroes or blanks. • Use Select County by Name to select/filter county. - Click ShowAll button first. - Key in any part of name and click Select County... button. - Search will filter for any name with that exact, case sensitive, spelling. - Travis (Travis county, Texas) is used as an example. • Click ShowAll button between specific queries. • Right-click row to copy to clipboard, then choose Copy. - Paste copied content to text editor or spreadsheet. Column Headers • Census Tract • State -- state postal abbreviation • County -- county name • 2010 Population -- Census 2010 population • 2014 Population -- 7/1/2014 population estimate • Population change -- 2010 to 2014 population change • %Population change -- percent 2010 to 2014 population change About the Estimates The census tract population estimates are based on several factors. Theses factors include the number of households (occupied housing units), population in households and group quarters population. The population is estimated annually and control-total adjusted to the Census Bureau annually updated county-level population estimates. See illustrative county population, components of change and age-race-origin profile for Travis County, TX ProximityOne User Group Join the ProximityOne User Group to keep up-to-date with new developments relating to metros and component geography decision-making information resources. Receive updates and access to tools and resources available only to members. Use this form to join the User Group. Support Using these Resources Learn more about accessing and using demographic-economic data and related analytical tools. Join us in a Data Analytics Lab session. There is no fee for these one-hour Web sessions. Each informal session is focused on a specific topic. The open structure also provides for Q&A and discussion of application issues of interest to participants. Additional Information ProximityOne develops geodemographic-economic data and analytical tools and helps organizations knit together and use diverse data in a decision-making and analytical framework. We develop custom demographic/economic estimates and projections, develop geographic and geocoded address files, and assist with impact and geospatial analyses. Wide-ranging organizations use our tools (software, data, methodologies) to analyze their own data integrated with other data. Follow ProximityOne on Twitter at www.twitter.com/proximityone. Contact us (888-364-7656) with questions about data covered in this section or to discuss custom estimates, projections or analyses for your areas of interest. |
|
|