
|
|
|
-- expanding neighborhood insights through data analytics .. tools and resources to access and use low and moderate income demographics by block group ... the ACS 2006-10 "low and moderate income (LMI) population by block group" special tabulation was released in 2015. This is an important data resource for anyone examining characteristics of the LMI population by block group and related small area geography. See related notes and more information about these data. Among the unique and powerful features of these LMI data include: • the data are tabulated at the block group level • the population with low and moderate income to the area median income .. unlike Census ACS, these data provide "area relative" analytical capability. This section reviews tools to use these data on a national or local level: • National scope BG-level interactive table shown below • GIS software and national scope LMISD BG GIS project Patterns of LMI Population by Block Group The following graphic shows block groups with 51% or more LMI population with orange fill pattern. See zoom-in views below. Click graphic for larger view; expand browser window for best quality view.  .. view developed with ProximityOne CV XE GIS and related GIS project. Patterns of LMI Population by Block Group; Houston Metro Area The following two graphics illustrate how the GIS resources (see below) can be used to examine patterns of the distribution of the percentage of low and moderate income population by block group. Develop this type of thematic pattern map for any area in the U.S. Click graphic for larger view.  .. view developed with ProximityOne CV XE GIS and related GIS project. Drill Down View of Houston City Area This zoom-in map reveals the ability to examine sub-neighborhood areas. 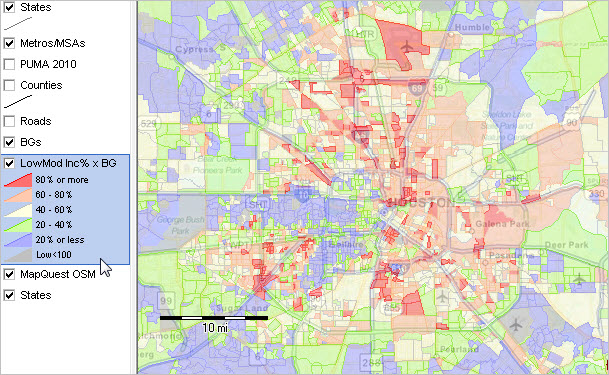 .. view developed with ProximityOne CV XE GIS and related GIS project. American Community Survey Block Group Data Block groups are the smallest geographic area for which the ACS data are tabulated. The approximate 220,000 block groups are subdivisions of census tracts and cover the U.S. wall-to-wall. Block groups are uniquely identified nationally using a 12 character geocode. In the application illustrations that follow, the Houston area block group "482012111004" which breaks down to state FIPS code 48 (Texas) + county FIPS code 201 (Harris county) + census tract 211100 + block group 4. Using GIS Resources; LMI Patterns; Houston Area Block Groups The graphic below shows patterns of the LMI population by block group in a circular study area. This is the start-up view when the GIS project described below is opened. The study area comparative analysis report described above has been prepared for the circular study areas.  .. view developed with ProximityOne CV XE GIS and related GIS project. Install GIS Resources (requires Windows computer with Internet connection) See terms of use 1. Install the ProximityOne CV XE GIS ... run the CV XE GIS installer ... take all defaults during installation 2. Download the LMISD BG GIS Project zip file . .. requires User ID 3. Expand the zip file to the folder c:\lmisd. 4. Initial start-up. ... after completing the above steps and with CV XE running (use desktop icon) ... use File>Open>Dialog to open the project file named c:\lmisd\lmisd1.gis ... the map view shown above should appear. Dallas ISD & Schools with LMI by Block Group Dallas ISD GIS project .. Dallas ISD shown with black boundary; Dallas ISD schools shown as red markers. Harrell Budd El School site study area shown with two blue circles -- 1 mile and 2 mile radius.  .. view developed with ProximityOne CV XE GIS and related GIS project. .. zoom-in to site view -- profile selected block group U.S. by Block Group; Low and Moderate Income Demographic Characteristics (ACS 2006-10) This table contains 220,000 rows of data and will initially require a few seconds to load. Click ShowAll button between Find/Queries. Use mouseover on column header to view column description. See usage notes below table. See related tables -- http://proximityone.com/rankingtables.htm. The above table presents low and moderate income summary data (LMISD) for all 220,334 block groups based on the 2006-2010 American Community Survey LMI special tabulation dataset. Columns: GEOID -- block group geocode AreaName -- integrated BG, tract and county/state name; example: "BG 4, Tract 2111, Harris County, Texas" St - state postal abbreviation St1 -- State FIPS Code County - FIPS county code Tract - census tract code (unique within county) BG - block group (unique within tract) LowIncome- lowincome population LMI - Low and Moderate income population LMMI - Low, Moderate, and Medium income population LMI Potential - population with the potential for being deemed Low, Moderate and Medium income. Use as the denominator for LOW, LOWMOD, and LMMI %'s LMI% - percentage of Low and Moderate Income population UCL Pop - uncapped count of Low income population UCLM Pop - uncapped count of Low and Moderate income population UCLM% percentage of uncapped Low and Moderate income population Usage Notes • If table not showing any rows; click ShowAll button below table. • Use vertical and horizontal scroll bars to navigate up/down or left/right. • Adjust column widths using column divider between header cells. • Find GEOID> button -- use to select block group using column 1. .. key in exact 12 digit BG code in edit box at right of button. .. click the Find GEOID> button ... table refreshes with matching BG row(s), • Find County> button -- use to select county rows on exact spelling of code in column 5. .. **use this only after first selecting a state** .. key in exact spelling of the county FIPS code; overwriting the value 201. .. example, if state=TX, then 201 is Harris County. .. click the Find County> button ... table refreshes with all BGs in selected county. • All items are as of the data collection period ACS 2006-10. • Click ShowAll button between specific area queries. ACS 2006-10 LMI by Block Group Special Tabulation The U.S. Department of Housing and Urban Development (HUD) sponsored development of the ACS 2006-10 "low and moderate income (LMI) population by block group" special tabulation released in 2015. The Census Bureau special tabulation was based on ACS confidential basic record data. The next similar special tabulation will be based on ACS 2011-15. While the general public use ACS 2011-15 will be released in December 2017, the ACS 2011-15 HUD LMI special tabulation will likely not be available until 2018 or later. These data provide estimates of the number of individuals living in families that are "low income" or "moderate income"; where low income means income below 50% of the area household median income, and moderate income means income below 80% of the area household median income. Area median incomes are areas that vary by region and are generally counties or metropolitan statistical areas except in the six states of New England where towns are used. ACS 2008-12 LMI by Block Group Special Tabulation HUD has also sponsored development of the Consolidated Planning/CHAS Data ACS special tabulation. Presently data are available based on ACS 2008-12. This special tabulation also provides LMI data by block group. Unlike the ACS 2006-10 LMI by Block Group data described in this session, 1) the CHAS data are more recent, 2) they cover a wider range of subject matter and 3) a continuing set of annual tabulations is planned. ACS 2009-13 A related upcoming section will cover these data. Support Using these Resources Learn more about accessing and using demographic-economic data and related analytical tools. Join us in a Data Analytics Lab session. There is no fee for these one-hour Web sessions. Each informal session is focused on a specific topic. The open structure also provides for Q&A and discussion of application issues of interest to participants. Additional Information ProximityOne develops geodemographic-economic data and analytical tools and helps organizations knit together and use diverse data in a decision-making and analytical framework. We develop custom demographic/economic estimates and projections, develop geographic and geocoded address files, and assist with impact and geospatial analyses. Wide-ranging organizations use our tools (software, data, methodologies) to analyze their own data integrated with other data. Follow ProximityOne on Twitter at www.twitter.com/proximityone. Contact us (888-364-7656) with questions about data covered in this section or to discuss custom estimates, projections or analyses for your areas of interest. |
|
|