|
|
CommunityViewer GIS Main Page • Get Shapefiles • Build/Save Project • Augment Project |
CommunityViewer QuickStart: Creating a Basic Map Project -- Idaho by County & Place
This section provides an overview of how the CommunityViewer software can be used to quickly build a map project. A map project is a file itself that contains references to map files (shapefiles) located on your computer. Once a map project has been created, it can be immediately opened with CV using the File>Open operation. The following view shows a zoom-in to the southeast part of Idaho and shows county and place boundaries. The steps to create the map project are summarized below. 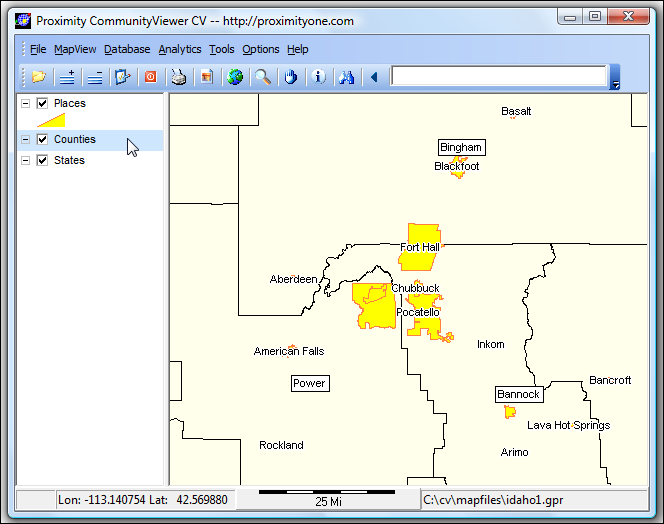
Application Objective. In this example, create a map project having a statewide view of Idaho showing county and place layers. An Internet connection is require to download the shapefiles. 1 -- Get the Shapefiles Start CV. Use File>Close to close any existing project. Use File>GeoGateway to load the U.S. by State shapefile onto your computer. When the GeoGateway form appears (see below), click the U.S. radiobutton, select the type of shapefile (U.S. by State), click GetData button. The downloaded shapefile is c:\cv\mapfiles\tl_2009_us_state.shp. 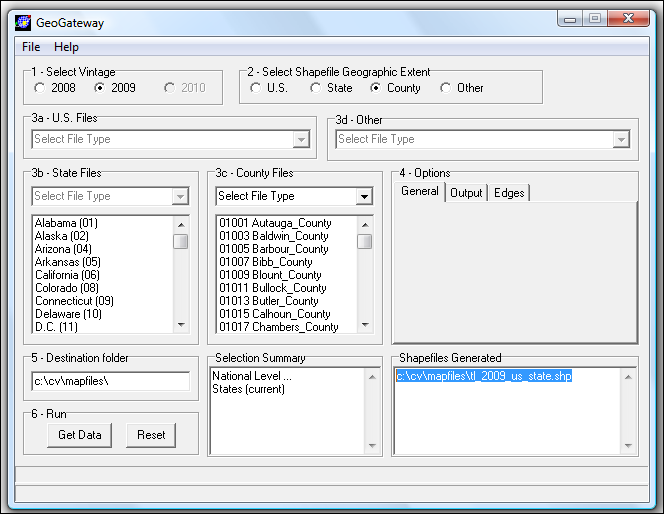
Get the Idaho by County shapefile. Do not close the GeoGateway form. Click the State radiobutton, select the state (Idaho), select the type of shapefile (State by county), click GetData button. The downloaded shapefile is c:\cv\mapfiles\tl_2009_16_county.shp. 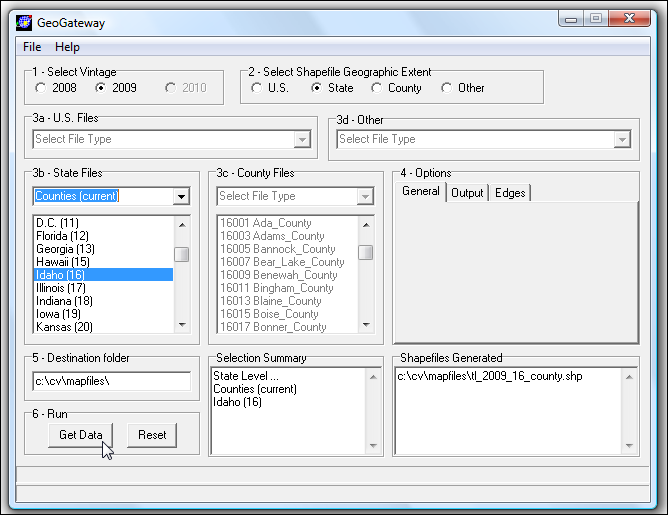
Get the Idaho by Places shapefile. Do not close the GeoGateway form. Click the State radiobutton, select the state (Idaho), select the type of shapefile (State by current places), click GetData button. The downloaded shapefile is c:\cv\mapfiles\tl_2009_16_place.shp. Close the GetGeoGateway form. 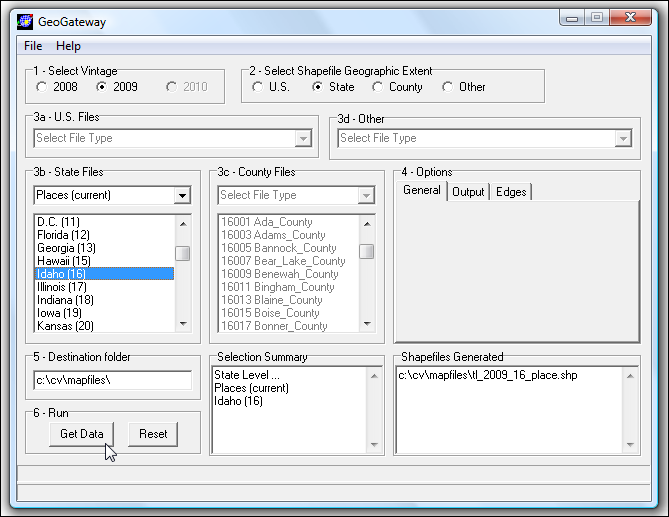
2 -- Build the Project From the main menu, use File>Open to open the U.S. by state shapefile. -- c:\cv\mapfiles\tl_2009_us_state.shp Use File>Save ProjectAs to save the project to filename c:\cv\mapfiles\idaho1.gpr. Use File>Open to open the idaho1.gpr project (c:\cv\mapfiles\idaho1.gpr). Click the zoom button and zoom to the state of Idaho. 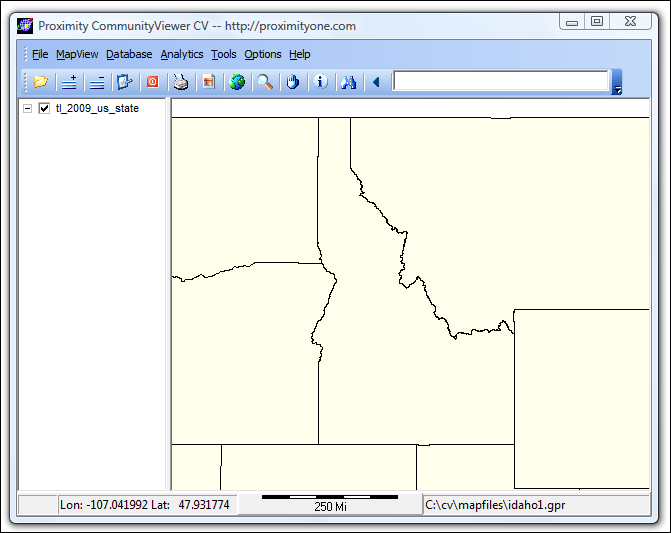
Add the Idaho state by counties shapefile. Click the Add Layers button and add the shapefile c:\cv\mapfiles\tl_2009_16_county.shp. 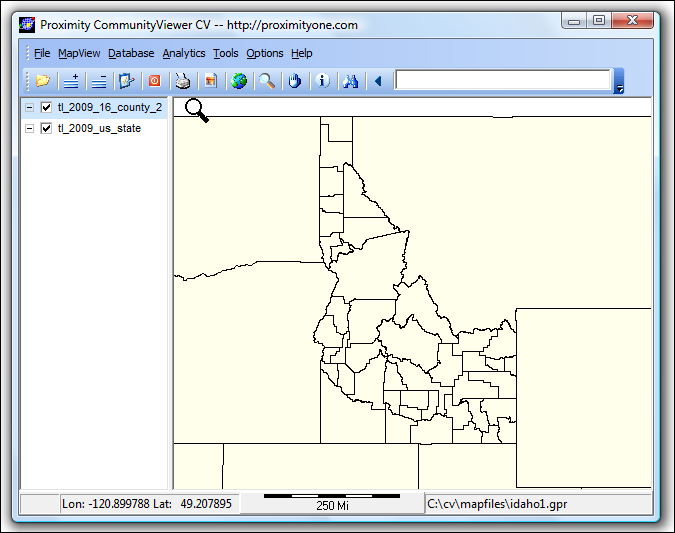
Add the Idaho state by places shapefile. Click the Add Layers button and add the shapefile c:\cv\mapfiles\tl_2009_16_places.shp. 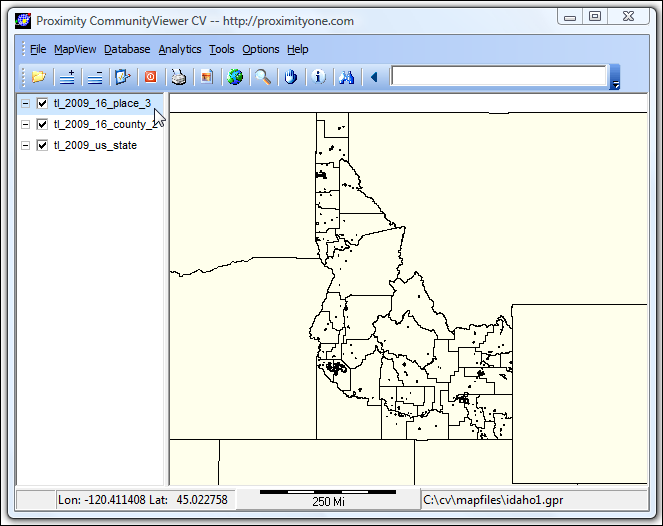
Save the project. Use File>Save. The basic project has now been developed. It can be recalled at any time. That is, CV can be closed, started, and the project file c:\cv\mapfiles\idaho1.gpr can be opened. 3 -- Augment the Project; Improve Appearance of Views Changing Places Fill Pattern and Appearance. Dbl-click the places layer name in the legend panel to start the Layer Editor. (see Layer Editor form opened below.) Click the Area tab. Change the Area color to yellow. Change the Area Outline color to orange with width 0.1pt. Click OK. 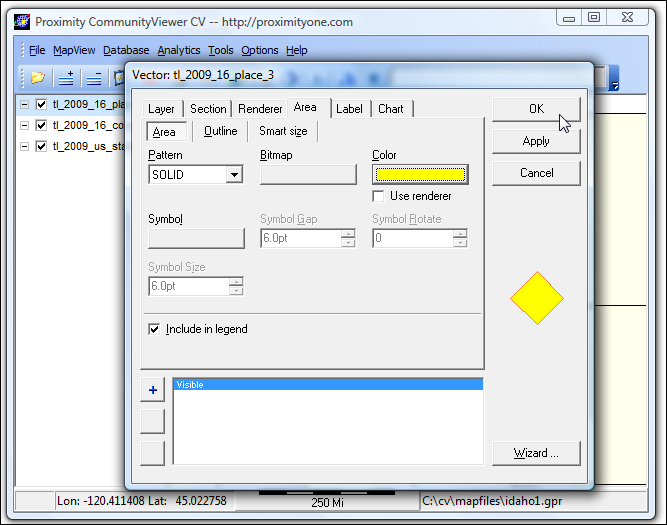
The view now appears as shown below. 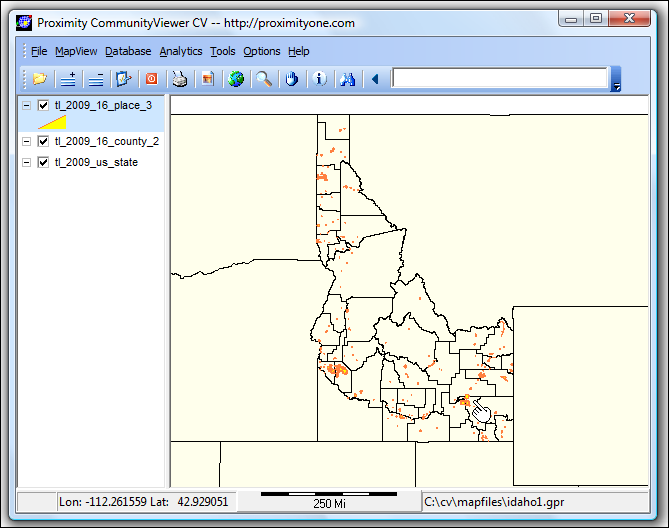
Use the zoom tool to create the zoom-in perspective shown below. 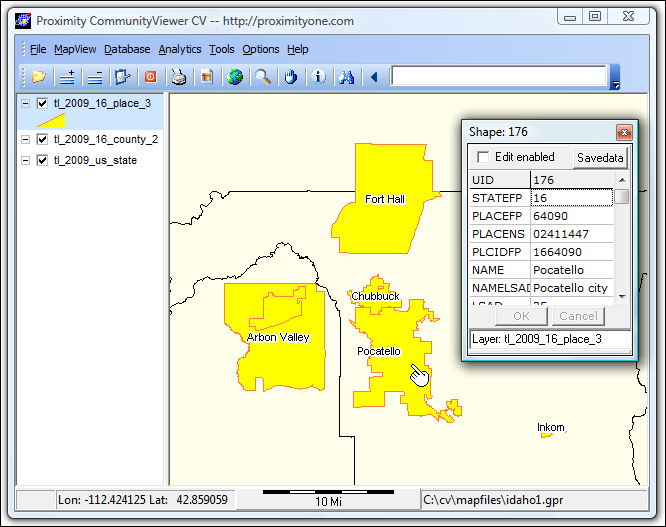
The places layer names shown in the above view are also added with the Layer Editor. Start the Layer Editor again with the places layer. Select the Labels tab (see above) and set label name to field NAME. Click OK. The Layer Editor closes. 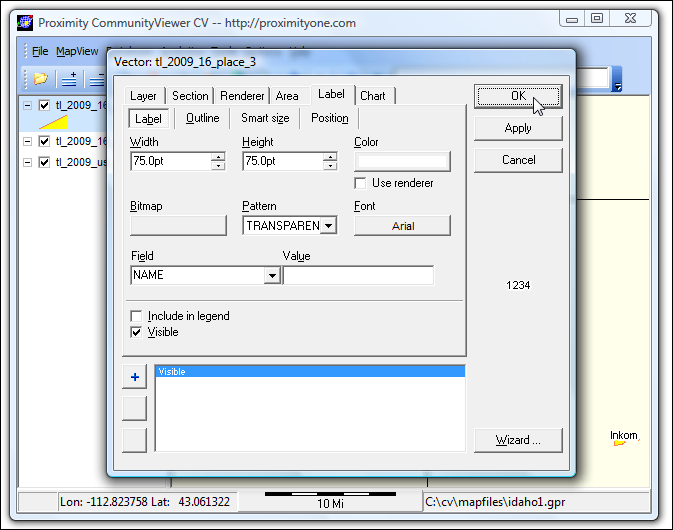
The "places zoom-in" view also shows the mini-profile for the place Pocatello. To show the profile, click the places layer once (turns blue making it active), select the identify tool (I), and then click the Pocatello area. The Layer Editor may be used with any layer. Dbl-click the county layer in legend panel. Select Labels tab. Create the county labels with the style shown in the following view (Bingham, Powell, Bannock ... even though not visible in this zoom view, all county labels are turned on and appear with a zoom-out view.
Use the File>Save Project. The map project has been created and may be recalled for later use. Additional Information Proximity develops geodemographic-economic data and analytical tools and helps organizations knit together and use diverse data in a decision-making and analytical framework. We develop custom demographic/economic estimates and projections, develop geographic and geocoded address files, and assist with impact and geospatial analyses. Wide-ranging organizations use our tools (software, data, methodologies) to analyze their own data integrated with other data. Contact Proximity (888-364-7656) with questions about data covered in this section or to discuss custom estimates, projections or analyses for your areas of interest. |
|
|