Charts

Contents
Layer Editor -- Chart Settings
Click the Chart tab at the top of the form. The Chart settings tab panel appears.
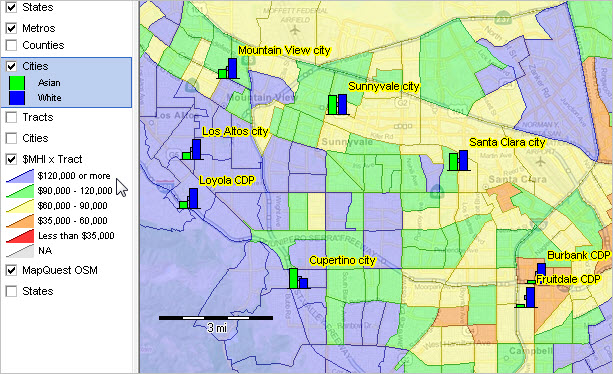
Chart enables you to place a bar or pie chart at the center of the geographic object.
Illustration of using pie chart to show White population (blue) and Asian population (green) by city in Santa Clara County, CA vicinity
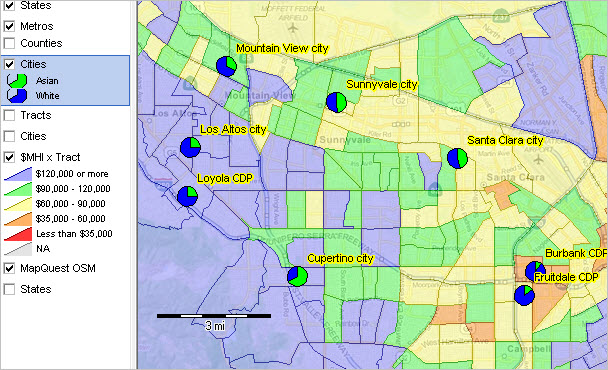
Illustration of using bar chart to show White population (blue) and Asian population (green) by city in Santa Clara County, CA vicinity