Site Analysis: Schools & Students

Contents
SiteAnalysis is used to analyze characteristics of user selected geographic objects (shapes in shapefiles) and create demographic-economic analysis maps and reports. SiteAnalysis is available as an integrated component within CV XE or as a standalone operation.
This section is focused on applications using the SiteAnalysis tools to examine patterns and characteristics of K-12 students and schools for one school district. These applications are described in this section:
| • | summarizing a selection of students by school |
| • | summarizing a selection of students by grade |
Visually examine the distribution of students that meet criteria of interest; specific to analytical/decision-making needs.
| • | Map/visual distributions make for more effective presentation and collaboration. |
| • | How many students of a certain age are in an attendance zone and how are they distributed? |
| • | How many students in a specific school are located along a prospective bus transportation route? |
| • | View the tabular count/summary of students. |
| • | View/analyze the set of selected students using both CV XE as well as spreadsheet or other software. |
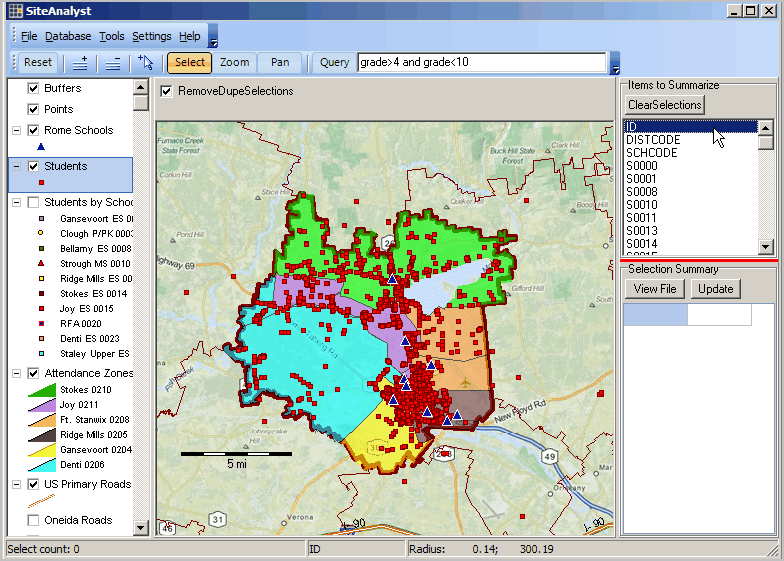
SiteAnalysis is started and a CV XE GIS project is opened. The school district focused project is opened as shown in the view below.
| • | The students layer is selected as shown in the control panel left. |
| • | Students are red square markers; schools are blue triangle markers. |
| • | Attendance zones are multi-colored areas; see patterns/colors in the control panel/legend to left of map. |
| • | In "Items to Summarize" (upper right) the ID field is dbl-clicked and will be used as the selection key. |
Summarizing a Selection of Students by School
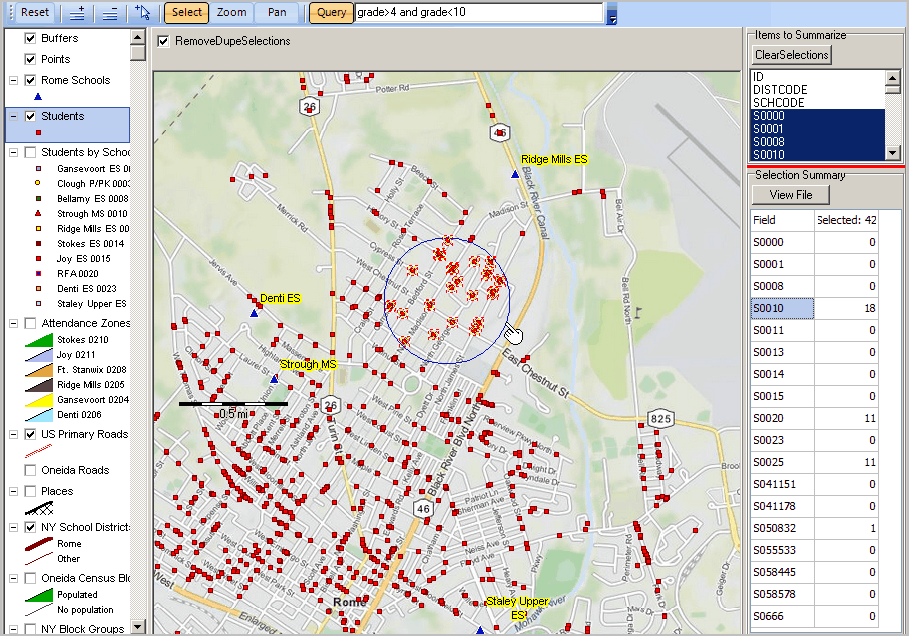
Schools are shown as fields in each student record. The next view:
| • | shows a zoom-in relative to the view above |
| • | has had the query applied -- grade>4 and grade<10 -- only students in grades 5 through 9 are included in the analysis. |
| • | shows that the "S" fields (S0010 is one school, S0020 is another school, etc.) have been selected for summary viewing |
| • | the attendance zones layer is un-checked so the layer does not show. |
The mouse is used to select a set of students (in a hypothetical area of interest -- to illustrate the process)
| • | 42 students meet the query condition in this area (shown as cross-hatched in the circle). |
| • | 18 of these students attend school with code S0010; 11 in S0020; 11 in S0025. |
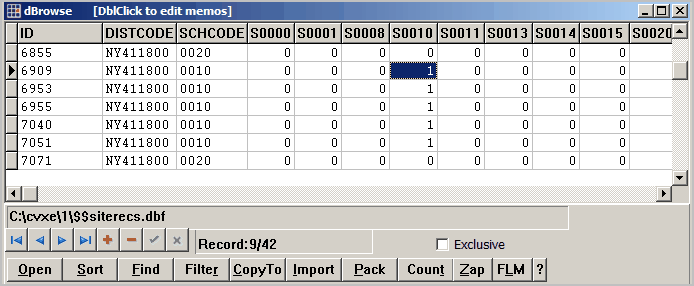
Click the ViewFile to see the student records for each of the 42 students. The following view appears. Each row is a student.
The view shows a scroll-down to student ID 6909. As shown by the highlighted cell, this student is enrolled in school S0010.
Other attributes for each student are shown to the right in each record, not visible in the graphic.
Summarizing a Selection of Students by Grade
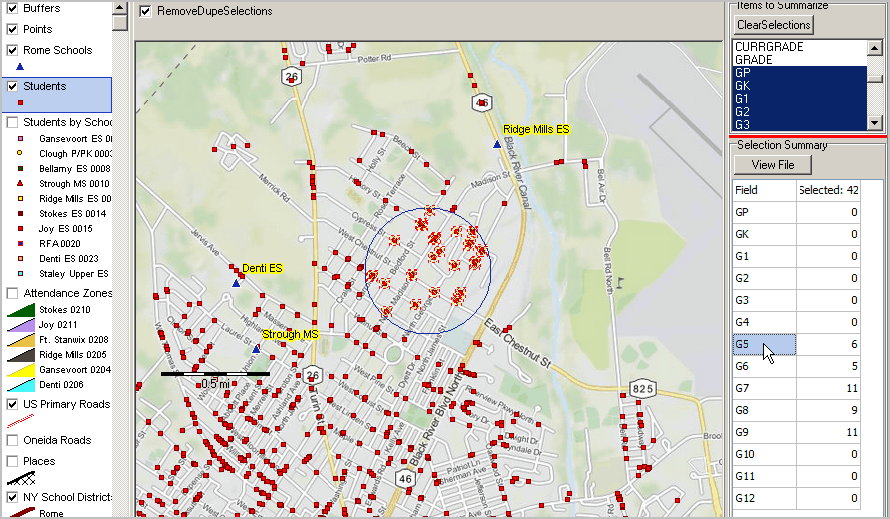
The same (or any other) group of students may be summarized as "count by grade" shown in the next view.
| • | To obtain this view, the field selections were changed from school to grade (upper right "Items to Summarize") then the group is re-selected. |
| • | The Selection Summary shows a summary by grade whereas the previous application shows a summary by school. |
| • | The Selection Summary shows there are 6 students in grade 5. |
See the main section on Site Analysis (click Analytics>Site Analysis in left panel) for a step-by-step summary of using Site Analysis operations.