Site Analysis

Contents
Analytics>SiteAnalysis invokes SiteAnalysis module and operations providing site analysis operations.
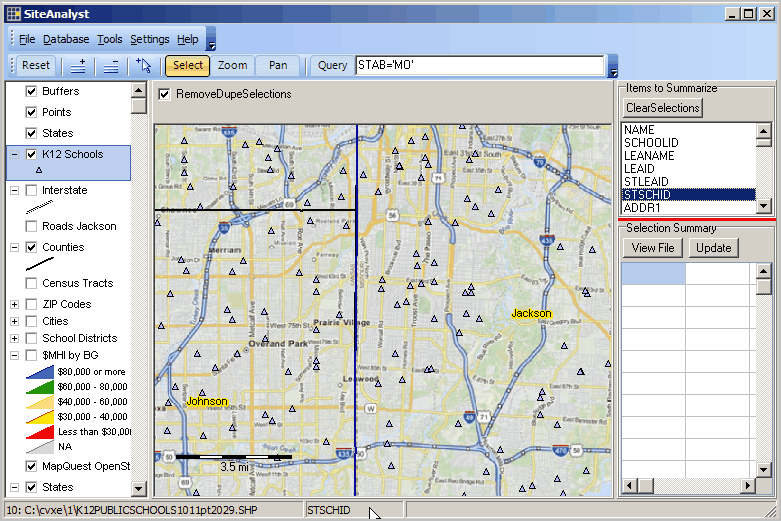
SiteAnalysis is used to analyze characteristics of user selected geographic objects (shapes in shapefiles) and create demographic-economic analysis maps and reports. SiteAnalysis is available as an integrated component within CV XE or as a standalone operation.
Availability
Level 1 and 2 option; included with Level 3
Usage
Main menu Analytics>SiteAnalysis
Related Information
http://proximityone.com/cv_siteanalysis.htm
Illustrative View
Kansas City, MO-KS area; see about related GIS project
Summary of Basic Operations
| 13. | Other Operations |
A GIS project must exist for Site Analysis to operate.
It is recommended that project development be performed in the CVXE main GIS form.
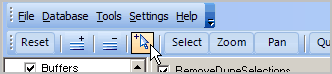
Start Tools>SiteAnalysis
- SiteAnalysis form appears (see above)
Open a GIS project
Select Layer to use for site analysis
- click layer name in legend panel to make active (turns blue)
- fields available in this layer/shapefile appear in upper right listbox.
Dbl-click field name in Site Analysis upper right listbox to use as code selection field.
- selected itemname turns blue; field name shows in statusbar (see above example where STSCHID is selected)
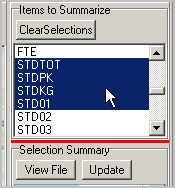
Multi-select items to be summarized in the Items to Summarize listbox. These should be numeric.
Summary data will be aggregated on these items and displayed in the grid "Selection Summary".
No items are required to be selected.
Site Processing is Now Enabled -- repeat analytical operations as follows
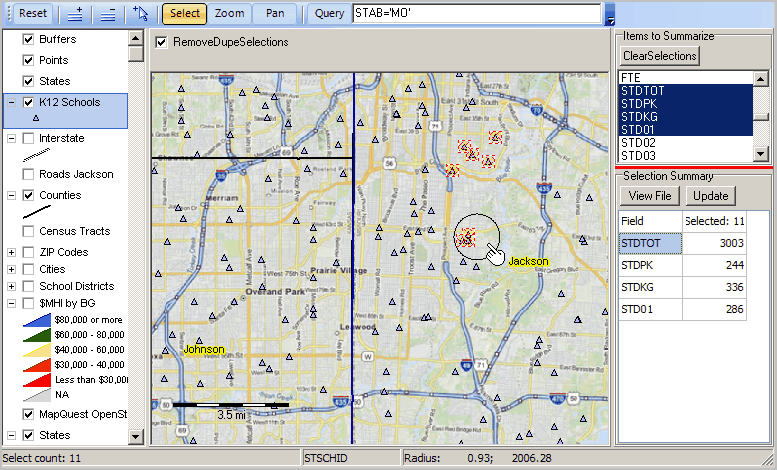
Select objects/shapes in the map window by left-clicking mouse, holding key down and dragging.
- the Select button (above Map) must be selected/orange to perform object selection.
- one to many objects/shapes (e.g., schools, block groups, counties) are selected and highlighted.
> see example in above view; selected objects show with cross-hatch.
- only those shapes/objects are selected that touch (intersect with) the selection circle.
- summary (aggregated) attributes of selected objects are displayed in the "Selection Summary" grid.
- repeat "Select objects/shapes" operation repeatedly, as desired
> for example, select additional or different objects
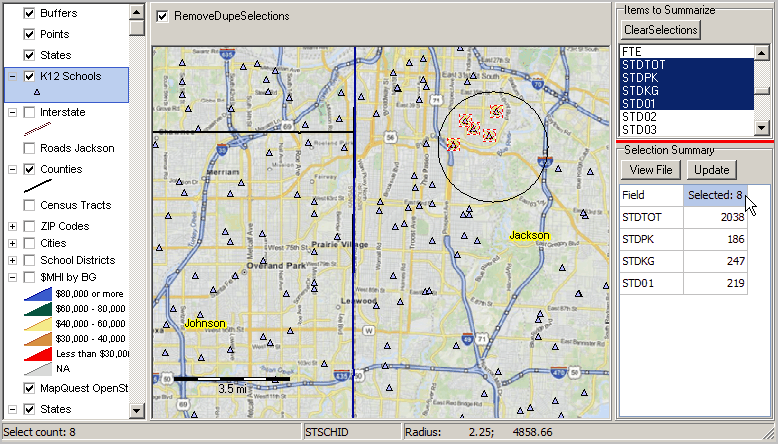
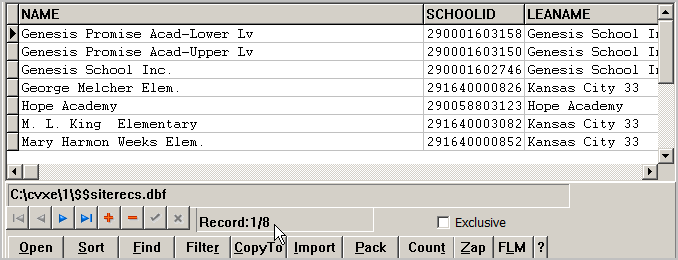
Illustrative view below: selected schools crosshatched; 8 schools selected; summary values shown shown in "Selection Summary" grid.
There is a total of 2038 students in these 8 schools. See next step to view details about these schools.
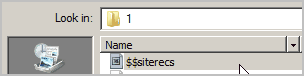
Click "View File" button to view data records for this selection.
The file is written to the file $$siterecs.dbf in the data folder (normally c:\cvxe\1). This file is overwritten each time a site selection is made.
The file opens; the full original data records are shown. Note there are 8 records. The file can optionally be exported.
Close this form and return to Site Analysis.
Optionally add more/different selections. The next view illustrates selecting a few more shapes and adding to previous group.
There are now 11 schools showing crosshatched. These schools have 3003 total students.
Optionally click View File to see updated full data record selection. Note the previous 8 records are shown with three new records added.
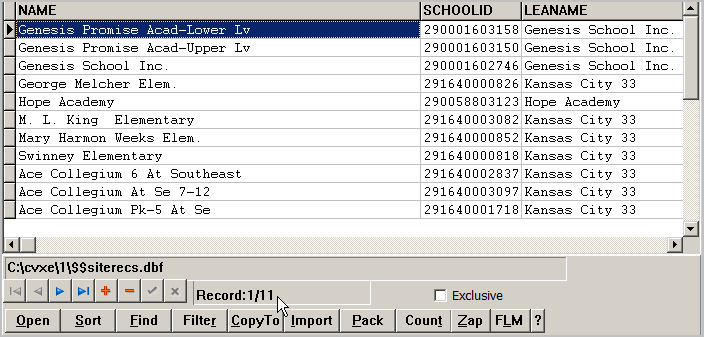
If site selection is ended now, the $$siterecs.dbf file is saved. The next time a site selection is processed, this file is overwritten.
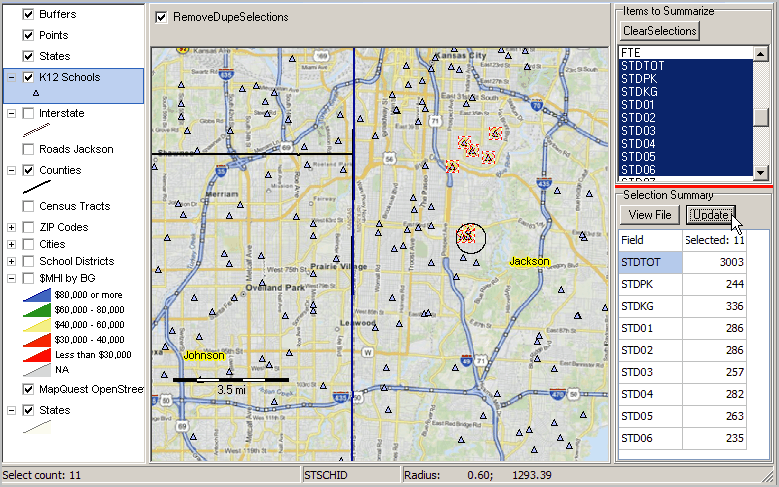
Using Update Feature in Selection Summary
Consider the situation where you have a set of selections and now want to modify the set of items to be summarized.
Rather than re-selecting the items (which is an option), proceed as follows:
| • | Change the item selections in Items to Summarize. |
| • | Click Update button. |
| • | At prompt "Add to Existing Selection Set?", reply Yes. |
| • | The view now appears as shown below. An additional 5 grades are now summarized (compared to the four previously selected). |
Apply or remove Query -- option
- apply a query to the active layer shapefile by entering SQL-like statement in Query box above Map/Grid.
- query is applied/removed (toggle) when Query button is clicked.
- when query applied only objects that meet the criteria can be selected.
> in the above example, only schools in Missouri (STAB='MO') would be selected.
If selecting students (not applicable in above project) and the current grade is in the "grade" field, the query
grade>=4 and grade<=10
will shown only those students meeting that criteria -- in grades 4 through 10.
There is no syntax checking on the query.
To show a profile of a selected shape/object, click the Identify tool on the toolbar.
When the Identify tool is selected (clicked on toolbar), the Select button turns blue.
The Select button must be orange/clicked before the site selection process can be resumed.
With the Identify tool selected, click on a shape/object to show a mini profile:
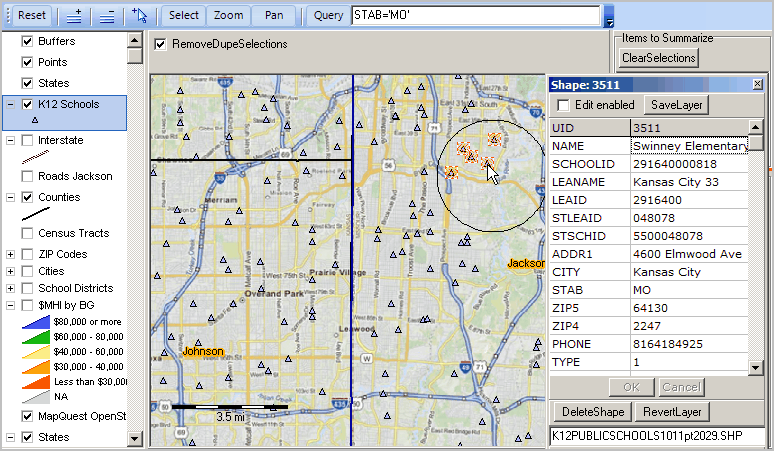
When the Identify tool is active and the mouse is clicked, the profile displays as shown above. The profile may be closed by clicking the X in the upper right corner of the form. When the profile displays, the content of the display is copied to clipboard. Optionally open a spreadsheet application and paste the data into cell A1.
Close Site Analysis form when processing complete.
It is recommended that no changes to project be made in the Site Analysis form.
Project development should be performed in the CVXE main GIS form.
Saving Data to Clipboard
When the Identify tool is used to show a mini-profile of an object (see above), the content of the display is copied to clipboard.
Optionally open a spreadsheet application and paste the data into cell A1.
When the grid is populated in the Selection Summary grid, the content of the grid is copied to clipboard.
Optionally open a spreadsheet application and paste the data into cell A1.