Tract Reports

Contents
Analytics>Tract Reports invokes Tract Reports module and operations to display tabular comparative analysis reports.
Availability
Level 3
Usage
Main menu Analytics>Tract Reports
Related Information
...
Start-up View
The 2000 to 2010 Tract Comparison Report provides a way to examine a set of Census 2000 census tracts and view/analyze corresponding Census 2010 census tracts. For example, until mid-2012 financial institutions were required to use Census 2000 census tracts and related demographics to meet various compliance, reporting and analysis requirements associated with FFIEC HMDA and CRA programs. Now regulations require use of Census 2010 census tracts. The service/assessment area often changes as a result of a new set of census tract boundaries, often with different codes, covering a similar but not exactly the same overall assessment area. Even where the service/assessment area is a whole county, changing tract codes and water/special designation area boundaries can result in change between Census 2000 and Census 2010 census tract boundaries.
There are many other applications that require knowledge of changing Census 2000 and Census 2010 census tract boundaries. Most local and regional governments must consider these differences in analyzing demographic change. Businesses that have used Census 2000 census tracts for sales or service territory assignment need to redefine the areas with Census 2010 census tracts in order to be able to use Census 2010 and post Census 2010 demographics. Health-related analyses often make use of census tract geography; similar to business related needs, the areas once defined in terms of Census 2000 tract codes must now be defined in terms of Census 2010 census tract codes.
Census tracts, averaging 4,000 population cover the U.S. wall-to-wall, are coterminous with county boundaries. See more about census tracts at http://proximityone.com/tracts.htm.
2000 to 2010 Tract Comparison Report
With CV XE GIS running, use File>Tools>2000-2010 Tract Comparison Report.
The start-up view, using the option of national scope tract files, is shown below.
CV XE GIS Overview of Shapefiles Generated -- Examining Changes Visually
The following graphic shows a zoom-in view of the Washington DC area using the Census 2000 census tracts (red boundaries and tract labels) and Census 2010 census tracts (gray bold boundaries and black labels) shapefiles developed using the application shown above. The TIGER/Line roads/edges shapefile has been added to show streets. The pointer is located near the White House.
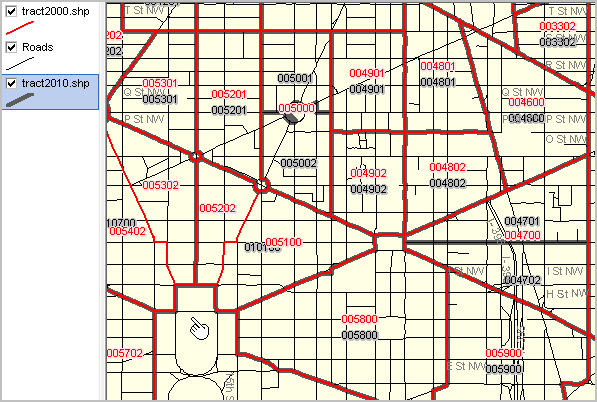
It can be seen that:
Census 2000 tract 004700 (47.00) was split to create Census 2010 tracts 004701 (47.01) and 004702 (47.02).
Census 2000 tract 005000 (50.00) was split to create Census 2010 tracts 005001 (50.01) and 005002 (50.02).
Census 2000 tracts 005202 (52.02) and 005100 (51.00) have been combined to create Census 2010 tract 010100 (101.00).
Generally tract splits and combines are not so neat and are split combined by parts. These examples are used as simple cases.
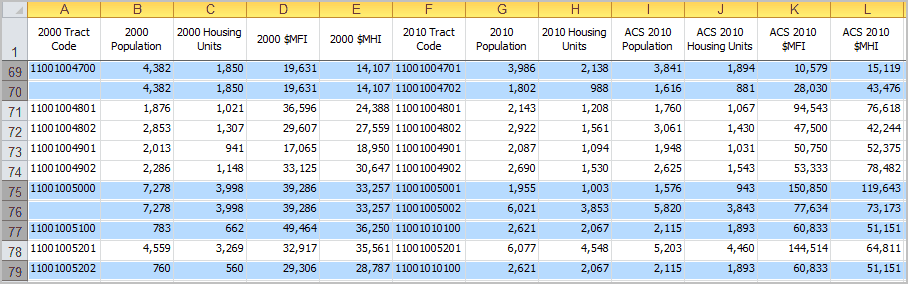
These tracts are highlighted in the 2000-2010 tract report view from grid (exported to XLS) shown below.
It can be seen that:
2000 tract 004700 had 2000 population 4,382 and related 2010 tract 004701 had 2010 population 3,982 and 004702 population 1,802.
2000 tract 005000 had 2000 population 7,278 and related 2010 tract 005001 had 2010 population 1,955 and 005002 population 6,021.
2000 tract 005100 (2000 pop 738) combined with 005202 (2000 pop 790) to form 2010 tract 010100 (pop 2,621).
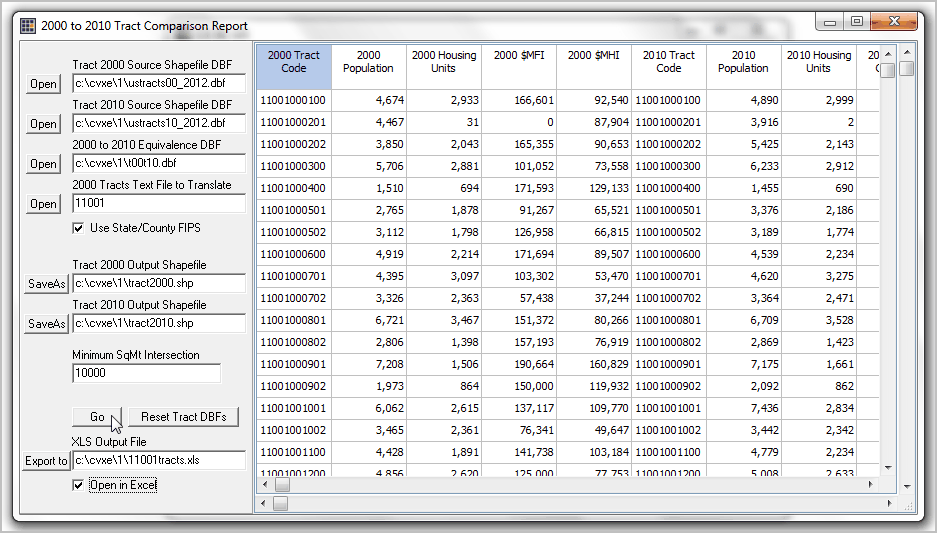
Overview of Tract Report Grid and Operation
Settings are made in the left panel and then the Go button is clicked to start the operations. In this example all Census 2000 census tracts in Washington DC are processed. The grid section at right shows a set of columns for Census 2000 (leftmost 5 columns) followed by a set of corresponding Census 2010 columns. Other columns showing ACS 2010 demographics and other data are reviewed below.
The report is prepared by processing either all Census 2000 tracts in a designated county or provided as geocodes in a tracts list file provided by the user. For each Census 2000 input tract geocode, all occurrences of geographic overlap/intersection are located. A row/record for each intersecting combination is written to the grid.
Control Section Options
Once the Control Section values are set, click the Go button to generate the grid report.
These actions are taken when Go processing proceeds:
| 1. | namelsad00 field in <Tract 2000 Source Shapefile DBF> tract records updated with Region code for Census 2000 tracts in <2000 Tracts Text File to Translate> |
| 2. | namelsad10 field in <Tract 2010 Source Shapefile DBF> tract records updated with Region code for Census 2010 tracts intersecting with Census 2000 tracts in <2000 Tracts Text File to Translate> |
3. Grid panel generated.
one row for Census 2000 tract and corresponding intersecting Census 2010 tract
4. <Tract 2000 Output Shapefile> generated.
5. <Tract 2010 Output Shapefile> generated.
Tract 2000 Source Shapefile DBF
ustracts00_2012.dbf
Census 2000 (TIGER Census 2010 vintage) shapefile structure required.
Tract 2010 Source Shapefile DBF
ustracts10_2012.dbf
Census 2010 (TIGER Census 2010 vintage) shapefile structure required.
2000 to 2010 Equivalence DBF
t00t10.dbf
National scope Census 2000 to Census 2010 tract equivalence file; intersecting area for 2000 and 2010 tracts.
2000 Tracts Text File to Translate
1 - User supplied list of Census 2000 tracts to be equivalenced
or
2 - State-County FIPS code for county to be processed
-- used if Use State/County FIPS checked (will process all Census 2000 tracts in specified county)
Tract 2000 Output Shapefile
Census 2000 tracts shapefile generated
default name tract2000.shp
Subset of <Tract 2000 Source Shapefile>
Only tracts are included that are in the list of Census 2000 tracts to be processed.
Tract 2010 Output Shapefile
Census 2010 tracts shapefile generated
default name tract2010.shp
Subset of <Tract 2010 Source Shapefile>
Only tracts are included that intersect with a Census 2000 tract processed.
Minimum SqMt Intersection
Specify minimum size of intersecting area between Census 2000 and Census 2010 tract to be included.
XLS Output File
When Export button is clicked the Grid content is exported to an XLS file.
If Open in Excel checkbox is checked, the exported grid XLS is auto opened in Excel.
Grid Column Content
2000 Tract Code |
11 character tract code |
2000 Population |
Census 2000 population |
2000 Housing Units |
Census 2000 housing units |
2000 $MFI |
Census 2000 median family income |
2000 $MHI |
Census 2000 median household income |
2010 Tract Code |
11 character tract code |
2010 Population |
Census 2010 population |
2010 Housing Units |
Census 2010 housing units |
ACS 2010 Population |
ACS 2010 population (5 year estimates) |
ACS 2010 Housing Units |
ACS 2010 housing units (5 year estimates) |
ACS 2010 $MFI |
ACS 2010 median family income (5 year estimates) |
ACS 2010 $MHI |
ACS 2010 median household income (5 year estimates) |
2012 Population |
ProximityOne 2012 population |
2012 Housing units |
ProximityOne 2012 housing units |
2012 $MFI |
ProximityOne 2012 median family income |
2012 $MHI |
ProximityOne 2012 median household income |