|
|
|
| |
Decision-Making Information
|
| |
ProximityOne
information resources & solutions
(888) DMI-SOLN
(888) 364-7656
|
Situation & Outlook Estimates & Projections: Geography
This section provides information on the
Situation & Outlook (S&O) estimates & projections geography.
The table presented below shows the number of geographic areas for which the American Community Survey (ACS) 2010 5-year 2006-10
estimates are developed.
S&O estimates and projections are developed for the types of areas with an X in the "Included" column.
The 2010-2016 estimates and projections are developed for Census 2010 geography.
| |
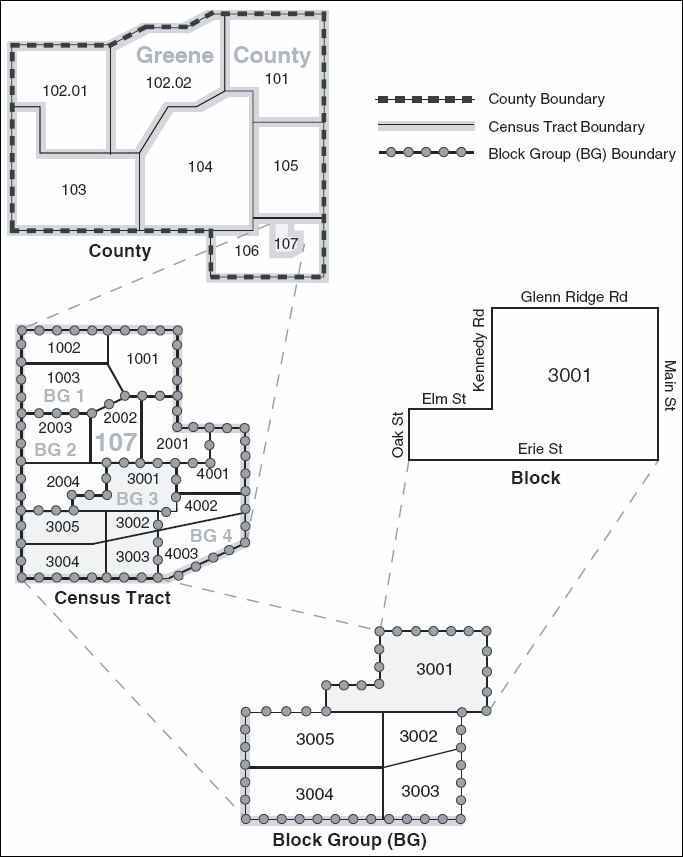
Tract-Block Group-Block Relationship
|
| |
click for larger view
|
| Type of Area | Included | Number of Areas |
| United States | X | 1 |
| Region | | 4 |
| Division | | 9 |
| States & District of Columbia | X | 52 |
| County or equivalent | X | 3,221 |
| County Subdivision | X | 36,513 |
| Census Tract | X | 66,322 |
| Block Group | X | 211,274 |
| Place (incorporated places and census designated places) | X | 25,302 1 |
| Consolidated City | X | 7 |
| Alaska Native Regional Corporation | | 12 |
| American Indian/Alaska Native/Hawaiian Home Land Area | | 656 |
| Metropolitan Statistical/Micropolitan Statistical Area | X | 953 |
| Principal City of Metropolitan or Micropolitan Statistical Areas | | 1,302 |
| Metropolitan Division | X | 29 |
| Combined Statistical Area | X | 127 |
| Combined New England City and Town Area | | 10 |
| New England City and Town Area | | 43 |
| Principal Cities of New England City and Town Areas | | 68 |
| New England City and Town Area Division | | 9 |
| Urban Area | | 3,625 |
| Congressional Districts - 111th & D.C. | | 436 |
| State Legislative District (Upper) | | 1,983 |
| State Legislative District (Lower) | | 4,791 |
| School Districts | X | 13,892 1 |
| ZIP Code Areas | X | 33,000 1 |
Notes
1 S&O estimation geography where number of areas can vary annually
Geography Distribution of S&O Geography by State
| State Name | State Code | Counties | MCDs | CCDs | Inc. Place | CDPs | Places | School Districts | Census Tracts | ZCAs | Block Groups | Blocks |
| Alabama | 01 | 67 | 0 | 390 | 453 | 41 | 494 | 133 | 1,081 | 625 | 3,329 | 175,220 |
| Alaska | 02 | 27 | 0 | 0 | 148 | 201 | 349 | 53 | 158 | 241 | 533 | 21,874 |
| Arizona | 04 | 15 | 0 | 78 | 87 | 163 | 250 | 240 | 1,107 | 364 | 3,570 | 158,294 |
| Arkansas | 05 | 75 | 1,328 | 0 | 500 | 19 | 519 | 245 | 624 | 595 | 2,135 | 141,178 |
| California | 06 | 58 | 0 | 387 | 474 | 607 | 1081 | 1026 | 7,049 | 1,678 | 22,133 | 533,163 |
| Colorado | 08 | 63 | 0 | 208 | 269 | 85 | 354 | 179 | 1,062 | 616 | 3,278 | 141,040 |
| Connecticut | 09 | 8 | 169 | 0 | 30 | 90 | 120 | 170 | 819 | 266 | 2,620 | 53,835 |
| Delaware | 10 | 3 | 0 | 27 | 57 | 18 | 75 | 19 | 197 | 65 | 502 | 17,483 |
| D.C. | 11 | 1 | 1 | 0 | 1 | 0 | 1 | 1 | 188 | 26 | 433 | 5,674 |
| Florida | 12 | 67 | 0 | 299 | 403 | 485 | 888 | 67 | 3,154 | 927 | 9,112 | 362,499 |
| Georgia | 13 | 159 | 0 | 577 | 535 | 61 | 596 | 180 | 1,618 | 707 | 4,788 | 214,576 |
| Hawaii | 15 | 5 | 0 | 44 | 0 | 131 | 131 | 1 | 286 | 89 | 646 | 18,990 |
| Idaho | 16 | 44 | 0 | 170 | 202 | 3 | 205 | 115 | 280 | 276 | 954 | 88,452 |
| Illinois | 17 | 102 | 1,708 | 0 | 1,287 | 26 | 1313 | 871 | 2,966 | 1,348 | 9,843 | 366,137 |
| Indiana | 18 | 92 | 1,008 | 0 | 567 | 34 | 601 | 294 | 1,414 | 762 | 4,798 | 201,321 |
| Iowa | 19 | 99 | 1,660 | 0 | 949 | 5 | 954 | 364 | 793 | 949 | 2,634 | 168,075 |
| Kansas | 20 | 105 | 1,535 | 0 | 628 | 3 | 631 | 319 | 727 | 692 | 2,299 | 173,107 |
| Kentucky | 21 | 120 | 0 | 481 | 435 | 32 | 467 | 174 | 994 | 766 | 3,157 | 122,141 |
| Louisiana | 22 | 64 | 596 | 0 | 302 | 96 | 398 | 69 | 1,106 | 518 | 3,509 | 139,867 |
| Maine | 23 | 16 | 495 | 0 | 22 | 89 | 111 | 315 | 348 | 399 | 1,143 | 56,893 |
| Maryland | 24 | 24 | 293 | 0 | 157 | 211 | 368 | 24 | 1,218 | 452 | 3,678 | 79,128 |
| Massachusetts | 25 | 14 | 351 | 0 | 45 | 190 | 235 | 352 | 1,367 | 501 | 5,053 | 109,997 |
| Michigan | 26 | 83 | 1,529 | 0 | 535 | 95 | 630 | 551 | 2,757 | 963 | 8,450 | 258,925 |
| Minnesota | 27 | 87 | 2,704 | 0 | 853 | 14 | 867 | 342 | 1,303 | 868 | 4,082 | 200,222 |
| Mississippi | 28 | 82 | 410 | 0 | 297 | 32 | 329 | 152 | 605 | 425 | 2,148 | 136,150 |
| Missouri | 29 | 115 | 1,379 | 0 | 951 | 21 | 972 | 523 | 1,320 | 1,016 | 4,540 | 241,532 |
| Montana | 30 | 56 | 0 | 191 | 129 | 146 | 275 | 429 | 270 | 349 | 874 | 99,018 |
| Nebraska | 31 | 93 | 1,234 | 0 | 531 | 6 | 537 | 254 | 503 | 578 | 1,591 | 133,692 |
| Nevada | 32 | 17 | 0 | 72 | 19 | 52 | 71 | 17 | 487 | 147 | 1,245 | 60,831 |
| New Hampshire | 33 | 10 | 259 | 0 | 13 | 47 | 60 | 180 | 273 | 227 | 874 | 34,728 |
| New Jersey | 34 | 21 | 566 | 0 | 324 | 181 | 505 | 616 | 1,950 | 582 | 6,510 | 141,342 |
| New Mexico | 35 | 33 | 0 | 130 | 101 | 133 | 234 | 89 | 456 | 352 | 1,413 | 137,055 |
| New York | 36 | 62 | 1,013 | 0 | 616 | 434 | 1050 | 729 | 4,907 | 1,619 | 15,079 | 298,506 |
| North Carolina | 37 | 100 | 1,051 | 0 | 540 | 115 | 655 | 115 | 1,563 | 783 | 5,271 | 232,403 |
| North Dakota | 38 | 53 | 1,704 | 0 | 361 | 12 | 373 | 187 | 227 | 382 | 630 | 84,351 |
| Ohio | 39 | 88 | 1,578 | 0 | 942 | 112 | 1054 | 615 | 2,941 | 1,160 | 9,354 | 277,807 |
| Oklahoma | 40 | 77 | 0 | 302 | 597 | 94 | 691 | 534 | 990 | 656 | 2,901 | 176,064 |
| Oregon | 41 | 36 | 0 | 211 | 240 | 69 | 309 | 198 | 755 | 409 | 2,490 | 156,232 |
| Pennsylvania | 42 | 67 | 2,579 | 0 | 1,019 | 382 | 1401 | 502 | 3,135 | 1,722 | 10,387 | 322,424 |
| Rhode Island | 44 | 5 | 39 | 0 | 8 | 19 | 27 | 33 | 234 | 70 | 821 | 21,023 |
| South Carolina | 45 | 46 | 0 | 296 | 268 | 100 | 368 | 85 | 867 | 407 | 2,859 | 143,919 |
| South Dakota | 46 | 66 | 1,259 | 0 | 309 | 41 | 350 | 159 | 235 | 381 | 688 | 77,951 |
| Tennessee | 47 | 95 | 0 | 462 | 349 | 33 | 382 | 140 | 1,261 | 612 | 4,014 | 182,203 |
| Texas | 48 | 254 | 0 | 860 | 1,192 | 318 | 1510 | 1032 | 4,388 | 1,866 | 14,463 | 675,062 |
| Utah | 49 | 29 | 0 | 90 | 235 | 54 | 289 | 41 | 496 | 278 | 1,481 | 74,704 |
| Vermont | 50 | 14 | 255 | 0 | 48 | 19 | 67 | 292 | 179 | 254 | 530 | 24,824 |
| Virginia | 51 | 135 | 544 | 0 | 229 | 142 | 371 | 134 | 1,541 | 886 | 4,749 | 145,399 |
| Washington | 53 | 39 | 0 | 242 | 279 | 243 | 522 | 295 | 1,318 | 563 | 4,825 | 170,871 |
| West Virginia | 54 | 55 | 240 | 0 | 234 | 48 | 282 | 55 | 466 | 735 | 1,588 | 81,788 |
| Wisconsin | 55 | 72 | 1,901 | 0 | 585 | 45 | 630 | 428 | 1,333 | 768 | 4,388 | 200,348 |
| Wyoming | 56 | 23 | 0 | 71 | 97 | 101 | 198 | 48 | 127 | 169 | 398 | 67,264 |
| U.S. | | 3,141 | 29,388 | 5,588 | 19,452 | 5,698 | 25150 | 13,986 | 65,443 | 31,913 | 208,790 | 8,205,582 |
Updated Geographic Areas
Geographic boundaries used for the S&O estimates and projections
correspond to the current official Census Bureau and OMB designations where applicable.
Some updated and unique geographic areas are not reflected in Federal boundary files.
Among these areas are School Attendance Zones and ZIP Code Areas.
These geographies are maintained in the ProximityOne GeoBase
(see additional information).
Additional Information
ProximityOne develops geographic-demographic-economic data and analytical tools and helps organizations knit together and use diverse data in a decision-making and analytical framework. We develop custom demographic/economic estimates and projections, develop geographic and geocoded address files, and assist with impact and geospatial analyses.
Wide-ranging organizations use our tools (software, data, methodologies) to analyze their own data integrated with other data.
Please use the Contact Proximity form or call us at (888) 364-7656 for more information about
the Situation & Outlook estimates and projections
... or custom estimates, projections, analyses for your areas of interest.
Add 'estimates and projections' in text section and any details relating to your specific interests
(scope/type of geography and subject matter).
|