Phoenix Metro Area -- Focus on Schools/School DIstricts

Contents
Illustrating use of CommunityViewer to view/analyze K-12 schools, school districts in context of school district community with drill down to intersection level of detail.
View demographic-economic trends profile for Maricopa County, AZ; access other county demographic profiles via ranking table links.
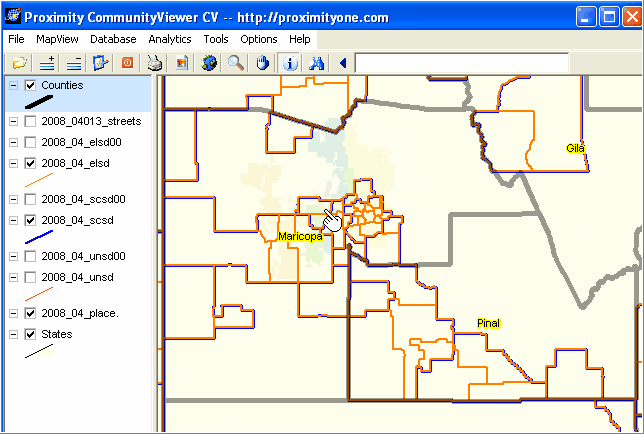
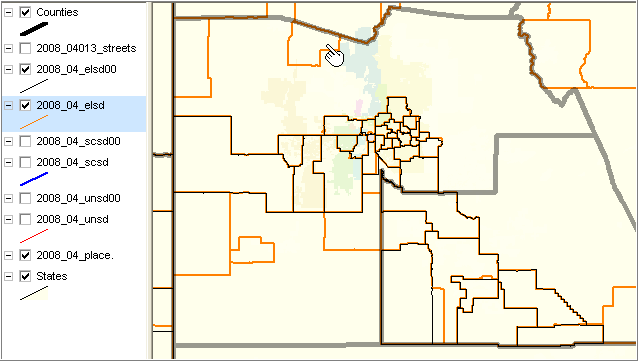
These application views focus on school districts in the Phoenix-Mesa-Scottsdale, AZ MSA two-county (Maricopa and Pinal) area shown in the next graphic. The legend at left shows the county boundaries, streets, two vintage of school districts (00 being 2000 and no designation begin current/2008) for each of elementary, secondary and unified school district types, and places/cities. Places/cities appear in the map view as muted background colors. A check in the layer checkbox indicates that layer is being actively shown in the map.
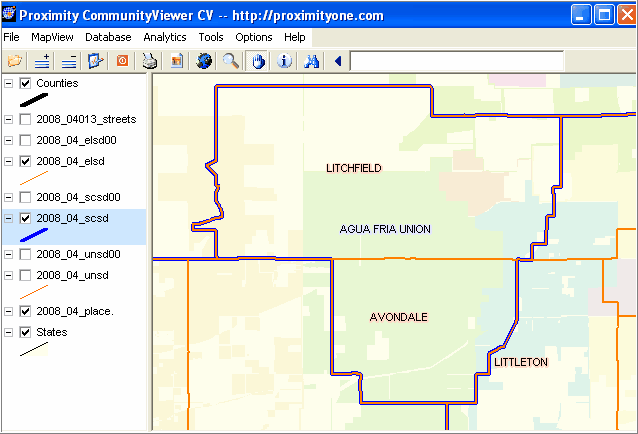
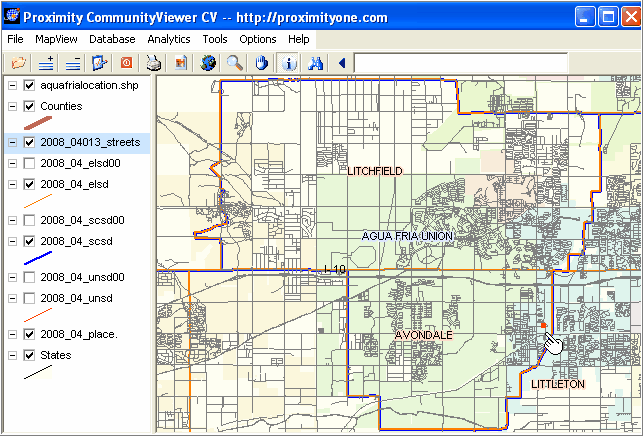
This view shows current vintage elementary and current vintage secondary school district boundaries in the map view. The next graphic is a zoom-in view of the Agua Fria school district (shown in the map below by the pointer).
Labels are turned on so that the names of corresponding districts can be identified. The muted colors show places including Avondale, Buckeye, Glendale, Litchfield, Phoenix among others. We will return to this view in a subsequent section to view a zoom in of streets and address lookups.
Similar map views may be flexibly developed for any area in the U.S.
|
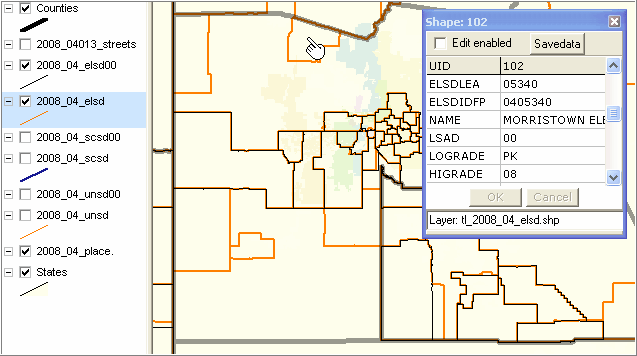
Changes in elementary school district boundaries. The next view is focused on Maricopa county (gray boundary) and elementary school districts (note in legend the elsd00 and elsd current are checked on). Since the elsd00 layer is placed "on top of" the elsd, the elsd layer will not show unless there is no elsd00 boundary. Using this method, it can be seen what is new since 2000. As an example, the orange boundary district by the pointer is new since 2000. There are many other examples.
The identify tool is used to profile that district. It is observed in the mini-profile that this is Morristown Elementary school district with Federal school district code 0405340.
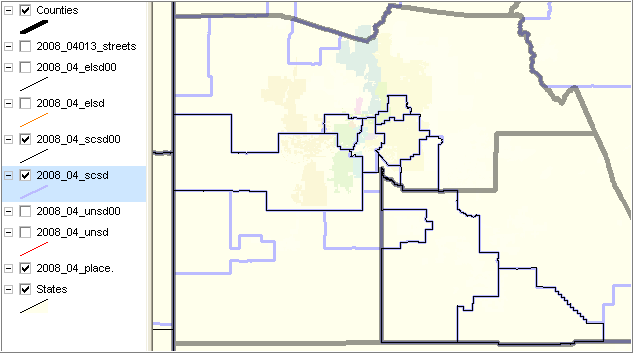
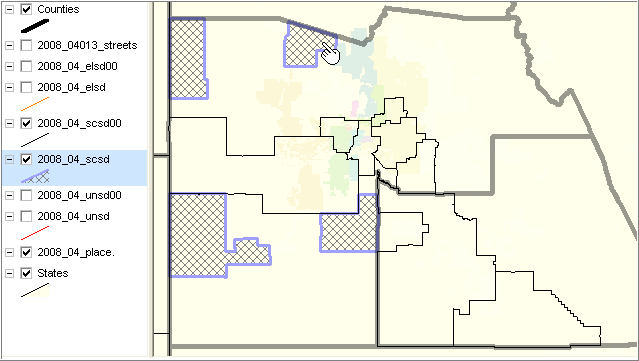
Changes in secondary school district boundaries. Similarly, changes in secondary school district boundaries since 2000. As an example, the light blue boundaries show secondary districts new since 2000.
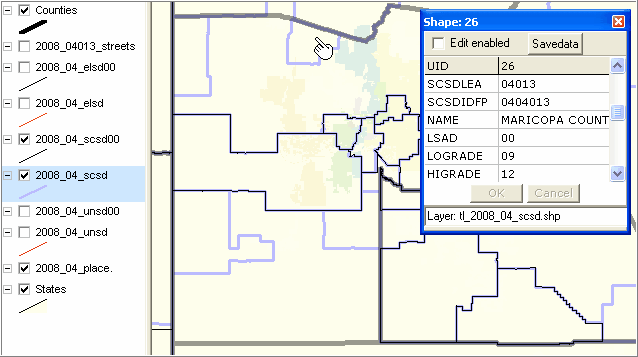
As with the similarly located elementary district, the same area (showing as a secondary district) is profiled. As shown in the min-profile, this area is part of the "Maricopa County High School District."
Using a CV query and setting this district code to a cross-hatch pattern, it can be seen that there are four separate areas that comprise the Maricopa County High School District.
Similar analyses can be performed in any area of the U.S.
|
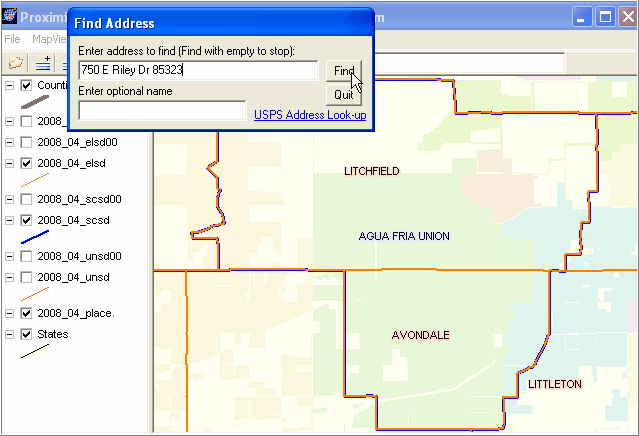
The CV Find Address tool is used to locate the school district address.
The address/location is shown by the red maker (lower right). A single point shapefile is automatically created.
The zoom tool is used to zoom-in to the location. The identify tool is used to profile a street segment.
|

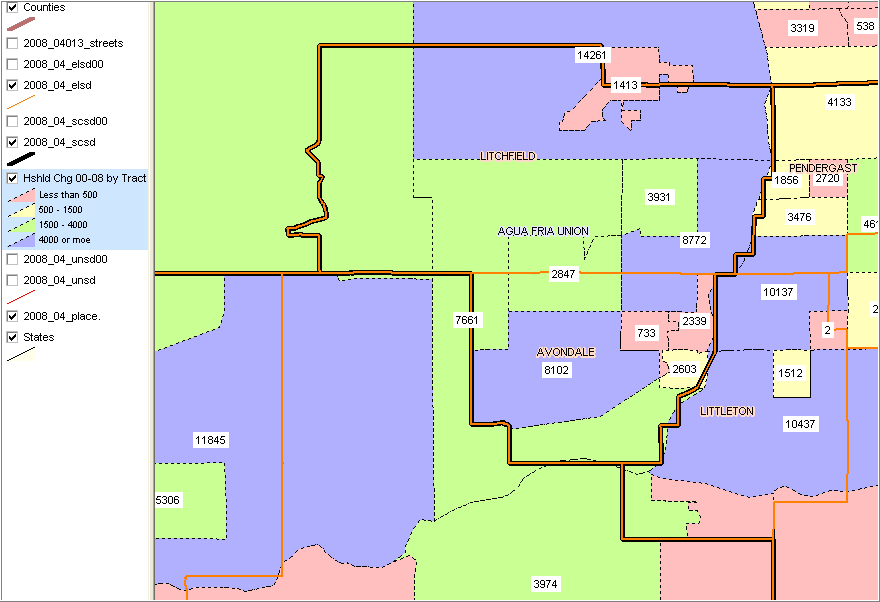
The next view shows census tracts as an additional layer. Census tract boundaries appear as dotted lines. Patterns of demographic change by tract are shown by colors. The legend shows colors associated with the number of households change between 2000 and 2008 by census tract.
Labels show the number of U.S. Postal Service residential deliveries in the the quarter 2008.
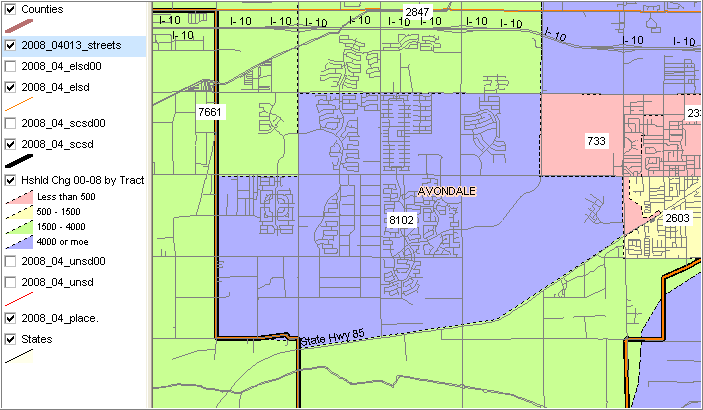
The final view shows a zoom-in to an Avondale district tract with streets overlay.
|