Kansas City Sites

Contents
Adding and Viewing your own Points/Locations in Context of Your Custom Geography
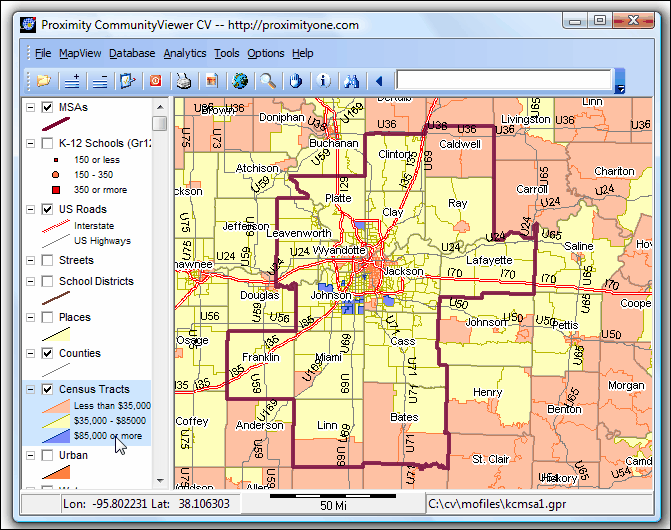
This section provides an overview of how the CommunityViewer software can be used to add your own points/markers and polygons/areas to a map. The map in the following view shows a thematic map of median household income by census tract for the Kansas City area. Tracts are shaded by colors for median household income as shown for the data value intervals in the legend panel (at left).
The next view shows a zoom-in to a region containing a study area for a new store location. The new area/layer, kcarea1, has been added by the user dynamically using the CV Add Shapes tool.
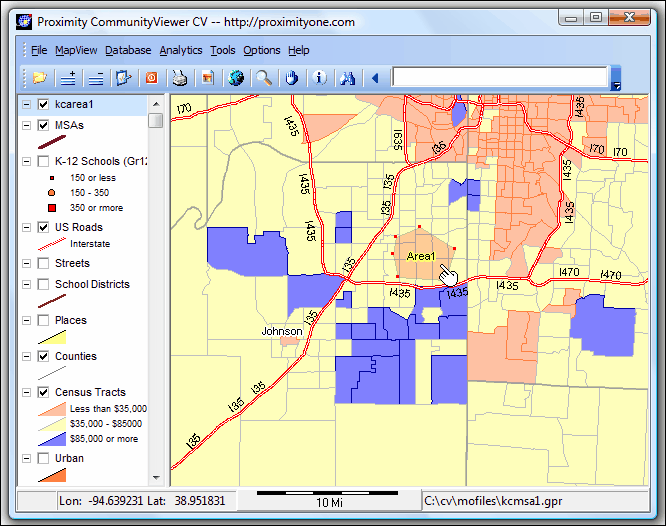
In this example, an investor seeks to examine locations that are available for a new store in context of competitor locations in the study area shown above. To facilitate the market analysis, two point shapefiles are dynamically created using the CV Add Shapes tool. Other geography and data can then be added to a project for analysis of an even broader set of data.
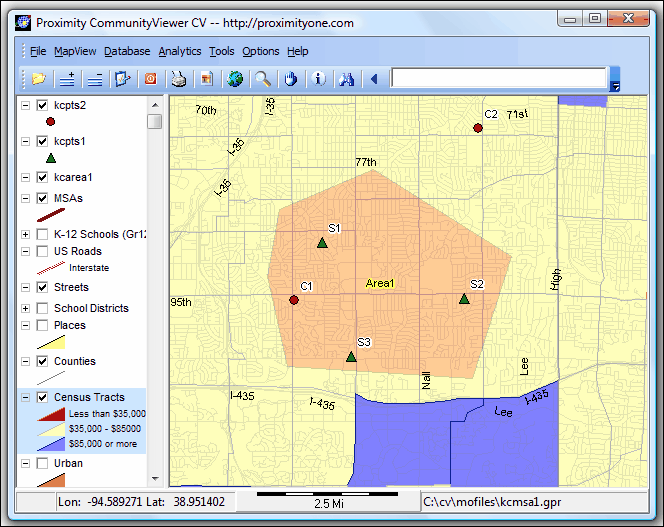
The two new point shapefiles/layers are shown in the next view. The competitor points layer (kcpts2) shows two locations as red markers. The prospective sites/points layer (kcpts1) shows three locations as green markers.
Add Shapes Operation
To perform these operations is simple and quick. Start CV and open the project to be used. Invoke the AddShapes operation using Tools>AddShape. Three options are available:
Add Points & Polygon
-- used to create both a points shapefile and polygon shapefile.
Add Points
-- used to create only a points shapefile.
Add Polygon
-- used to create only a polygon shapefile.
When the Add Point & Polygon option is selected, points are clicked onto the map. Each point becomes a vertex forming the polygon also being created. A dbl-click signals end of the process, closing the polygon. As the process is completed, a points shapefile and polygon shapefile are created.
The Add Point(s) option may be used to add one or more points. If one point is to be created, a single dbl-click creates the single point shapefile.
The Add Polygon option is used to create only a polygon.
Multiple shapefiles may be created to view multiple areas at the same time.
As the operations start, a prompt appears for the name of the shapefile to be created. The file name selected must not be in use. It will be created by the process. The previous point added may be undone by clicking the right mouse button.
A message then appears 'Start adding points. Dbl-click to close polygon'. The message varies by type of operation.
The process is ended with a dbl-click (on the last point) and a message such as 'New marker shapefile created.' appears. The shapefile(s) are added to the project.
Modifying Shape Attributes
Attributes of the study area (e.g., name, market potential, etc.) are easily added manually or with data merging operation. Alternative areas can be added. Prospective sites and competitor locations can be easily added or deleted; and attributes added manually or with
automated operations.
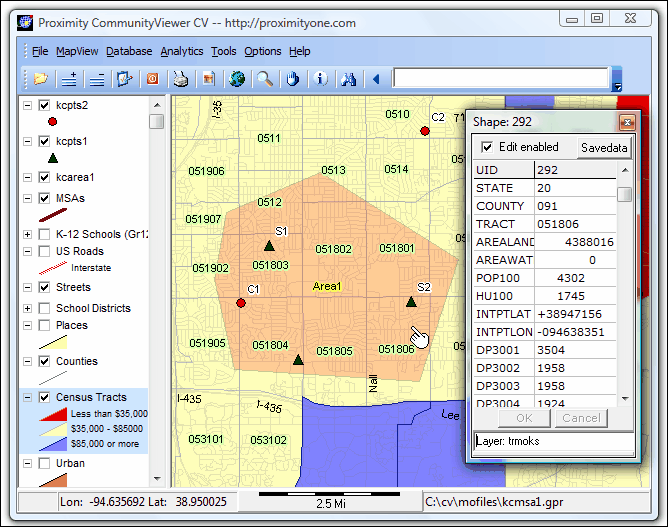
To change a record/field value click in the cell and key in the new value. Clicking in any other cell following the change automatically updates the file permanently.
The final sample view (for this section) is shown below. All streets are displayed in a semi-transparent manner. Census tract codes are shown as labels for tracts. The identify tool is used to display a mini-profile to assess more detailed demographic characteristics of the (any) tract.
The project can now be closed, saved and recalled at a later date. Different versions can easily be saved. A next step might be use of the site analysis tool.