Pitt County, North Carolina

Contents
Illustrating use of CommunityViewer to view/analyze demographic-economic attributes in context of wide-ranging geography with drill down to the intersection level.
View demographic-economic trends profile for Pitt County, NC; access other county demographic profiles via ranking table links.
Pitt County, coterminous with school district, shown with red crosshatch is a part of the 2-county Greenville, NC MSA. Metropolitan statistical areas (MSAs) appear with orange fill pattern and gray boundary.
|
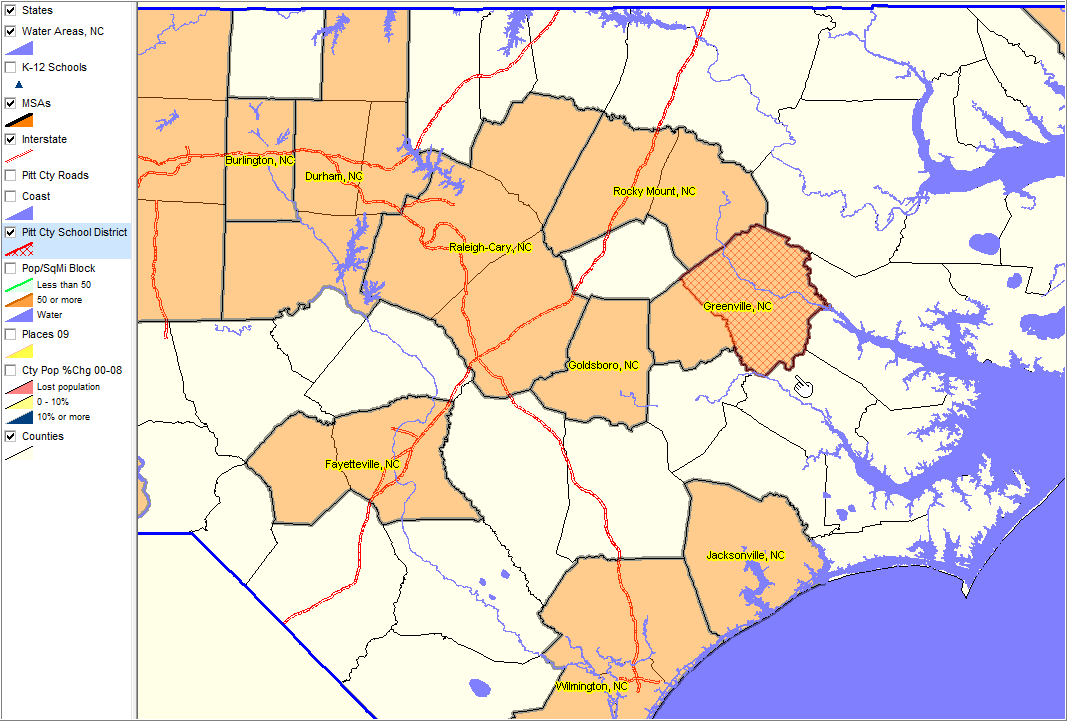
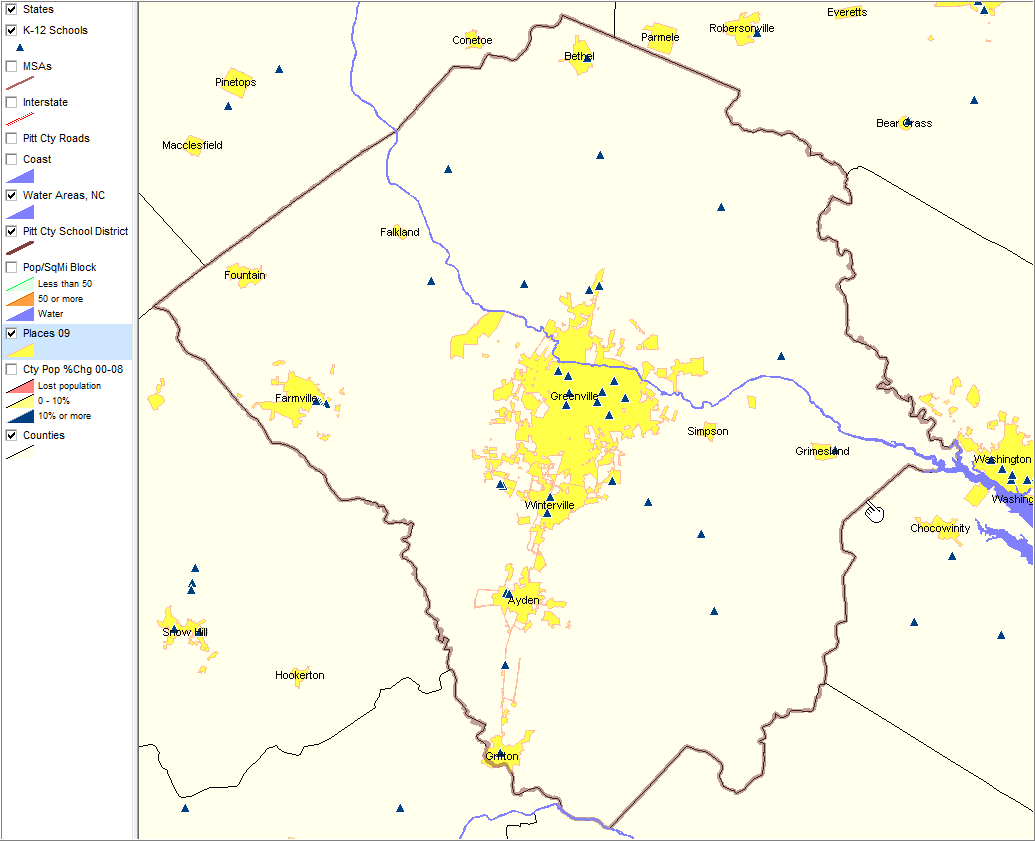
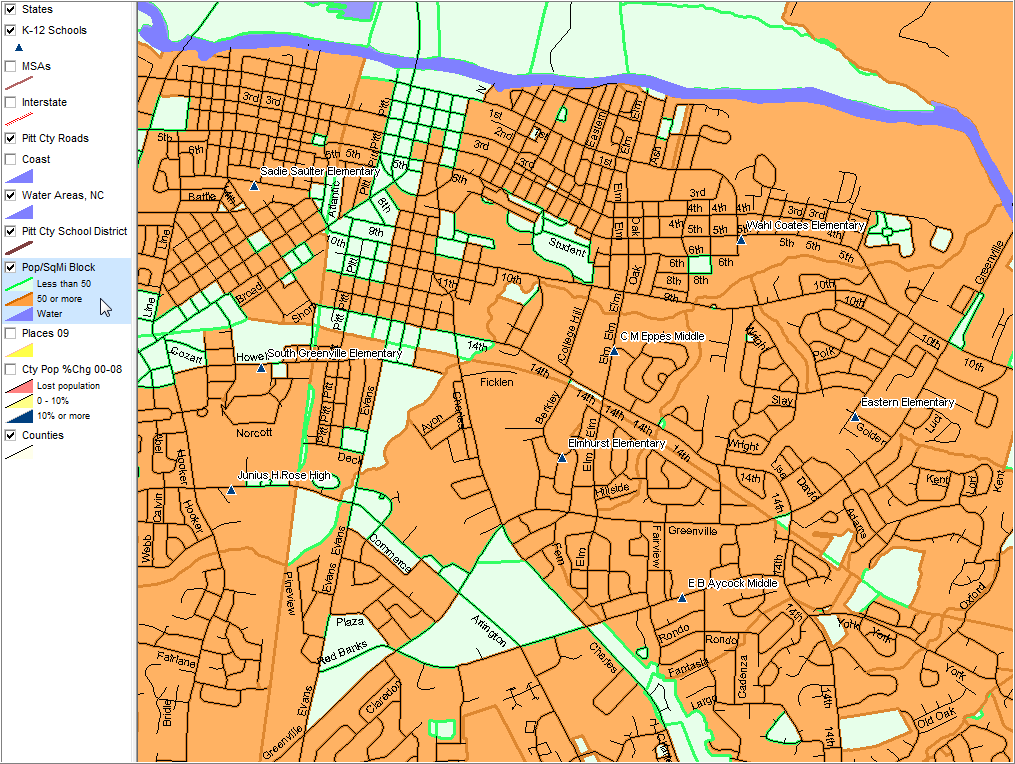
Cities shown with yellow fill pattern. Pitt County School District and County are coterminous and shown with light brown boundary. K-12 schools shown with triangle markers.
|
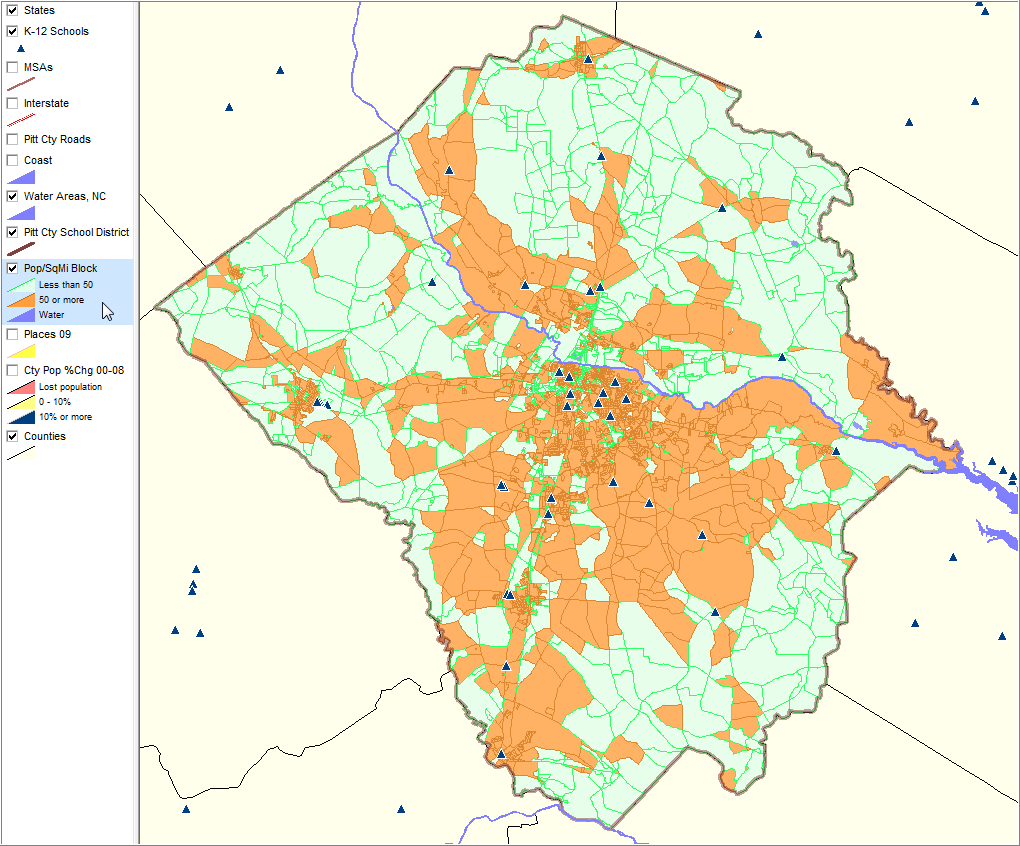
View developed using the Proximity Census Blocks database -- http://proximityone.com/c2kblk.htm. Census blocks cover the U.S. wall to wall and are designed to average 100 population. See density pattern in legend at left. Lower population density census blocks appear with light green fill pattern and darker green boundary. Higher population density census blocks appear with orange fill pattern and darker orange boundary.
|
I
|
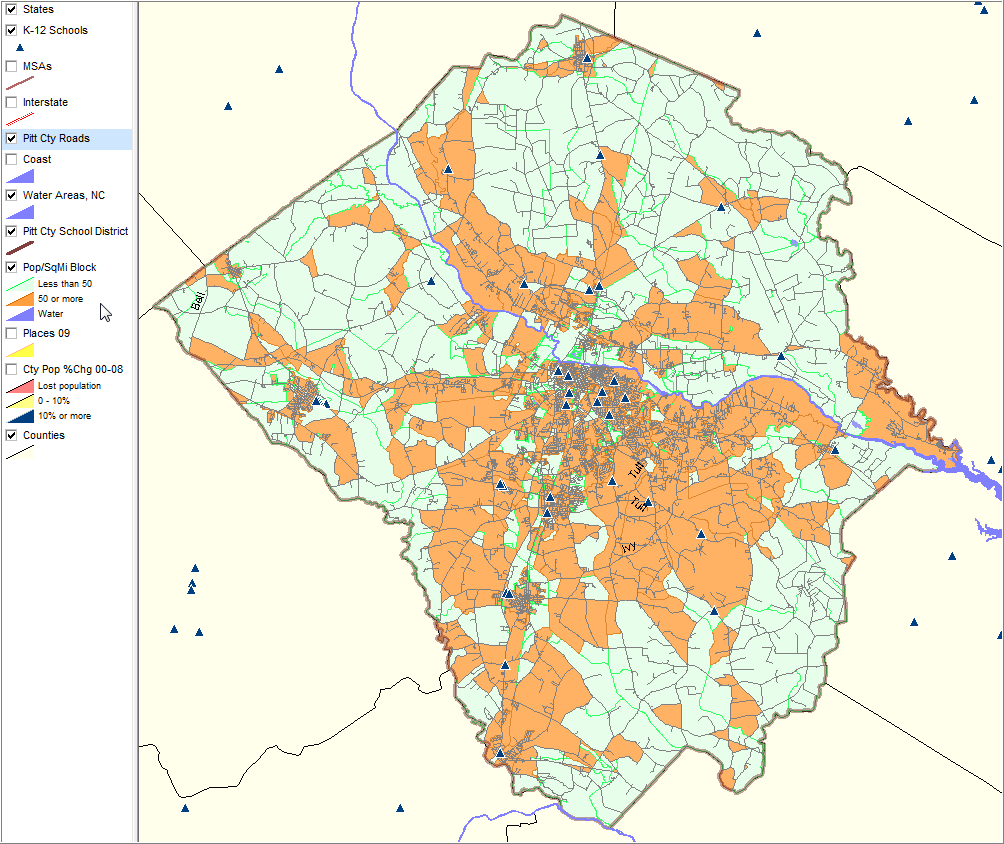
Block boundaries bolded to show in context of streets (black). Illustrates school and street labeling.
|
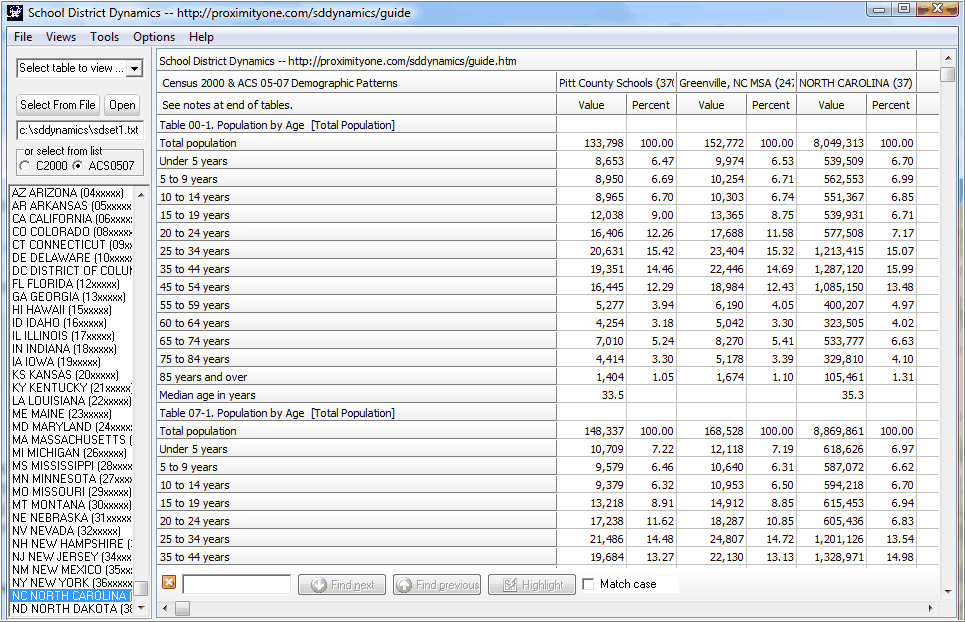
The next graphic illustrates use of the Proximity School District Dynamics (SDDynamics) software/database to display a side-by-side comparative analysis view of Pitt County, Greenville, NC MSA and the State of North Carolina demographic characteristics. Only a small portion of the data are shown. Access/view full set of data in XLS structure at http://proximityone.com/sddynamics/sdp1_pittcounty_nc.xls. This profile shows data from the Census Bureau Census 2000 and American Community Survey 2005-07 programs organized for comparison.
SDDynamics can used used to prepare this type of comparative profile for any combination of school districts, metros, and/or states. See http://proximityone.com/sddynamics/guide for more information about SDDynamics.
|