Demographic-Economic Characteristics
Harrisville Central (3613770) is a school district located in Lewis County, NY.
The total population of the district was 2,478 as of 2010. The total median age was 43.2 years compared to 38.0 years in New York.
The population distribution by age shows 0-4 years 129, 5-9 years 167, 10-14 years 196, and 15-17 years 73.
The race/origin population distribution shows White alone 2,394, Black/American American alone 2, American Indian/Alaska Native alone 21, Asian alone 19, Native Hawaiian/OPI alone 4, Other race alone 8, Two or more races 30, Hispanic/Latino Origin 28.
Among the population 3 years and over, school enrollment demographics show a total enrollment of 511 that included 26 in preschool, 430 in primary and secondary and 55 in college.
The educational attainment levels for the population 25 and over were 84.4% high school graduates and 10.9% college graduates.
The median household income was $43,490 compared to $57,683 in New York. The percent of families in poverty was 8.8; the percent of all people in poverty was 12.0; the percent of people under 18 years in poverty was 10.6.
Housing occupancy ... of the 1,773 total housing units, 58.4% were occupied and 41.6% were vacant.
Occupancy tenure ... of the 1,035 occupied housing units (households), 82.0% were owner occupied and 18.0% were renter occupied.
Units in structure ... of the 1,773 total housing units, there were 78.7% 1-unit detached, 0.7% 1-unit attached, 2.8% 2 units, 1.6% 3-4 units, 0.0% 5-9 units, 0.0% 10-19 units, 0.3% 20 or more units, 15.9% mobile home.
The median housing value was $84,100 compared to $295,300 in New York. The median gross rent was $729 compared to $1,061 in New York.
About this Document
This document provides decision-making information to help leadership and stakeholders better understand
where we are now; the what, when and where things will change in the future; and how change might impact us.
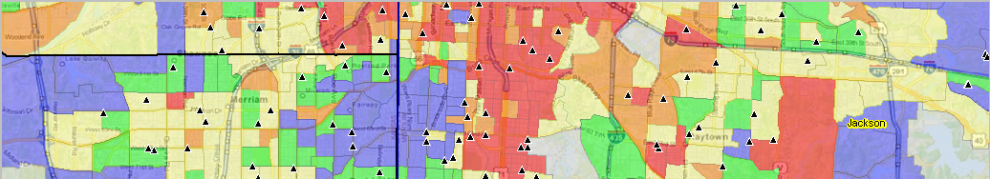
The graphic at the top of the page provides a visual example of how these resources can be used, though focused mainly on the "now" dimension. This is a view developed by GIS software showing a thematic pattern of median household income by Census 2010 block group using American Community Survey (ACS) data. Subject matter data from ACS have been integrated into the block group shapefile (TIGER/Line). The view is located in the Kansas City metro but could be anywhere in the world.
The thematic pattern of median household income by block group is shown as a layer superimposed on a MapQuest OpenStreetMap layer used as a base layer. Schools are shown as triangular markers. Other wide-ranging geography and subject matter could be added to the view, merging diverse independent entities into a holistic picture for collaboration and decision-making.
Using Data in this Document
The selection, scope, organization and content of these data provide a basis for examining challenges and opportunities that lie ahead. The data provide information for decision-makers and stakeholders to better determine how they might benefit from plans and actions implemented now or scheduled for the future. The data provide a basis for collaborative planning among community/business stakeholders and leaders. These data can provide measures of how things have changed since an earlier point in time - often based on data from Census 2000. Assessing this change, and considering current and prospective change, provide insights into the future - how much might things change, at what time, by how much and where - and how might this change impact us?
Organization of Data
Examine demographic-economic characteristics of the area using four custom developed demographic-economic profiles (DEP). Click a link to view the profiles listed below.
General Demographics -- click link to view full DEP1 profile
Social Characteristics -- click link to view full DEP2 profile
Economic Characteristics -- click link to view full DEP3 profile
Housing Characteristics -- click link to view full DEP4 profile
|
Interactive Tables to Rank/Compare Areas Use these Web-based interactive tables to view, rank, compare data shown in the above profiles for other districts. • General Demographics • Social Characteristics • Economic Characteristics • Housing Characteristics This report has been developed using the ProximityOne Situation & Outlook (S&O). See more about the Situation & Outlook resources at http://proximityone.com/situation&outlook.htm. See related information at regarding the S&O Estimates & Projections (http://proximityone.com/dataresources/guide/dr_outlook_5year.htm). Sources This report has been developed by ProximityOne (http://proximityone.com) based on data from the Census Bureau American Community Survey (ACS) 2012 5 year estimates and related data. Except as noted, all demographic-economic data are from the ACS 2012 5-year estimates. Additional Notes The ACS 2012 5-year estimates are based on a sample survey. The estimates are subject to sampling and other errors of estimation. Having used these data extensively, it is our judgment that these estimates are quite accurate. Terms of Use This report may be redistributed without further authorization provided that no fee is charged for use of the report or its content and that the report is distributed in full and complete form. There are no warranties, express or implied, about any content of this report. The reader/user of this report, and all content within the report, is solely responsible for any data use or interpretation. Contact Us Send your message or question to us at http://proximityone.com/contact.htm or call (888)364-7656. Copyright (c) 2014. ProximityOne. All Rights Reserved. |