|
|
|
School Districts Main Page |
School District Comparative Analysis Demographic Profiles
Register here to obtain a comparative analysis demographic profile comparing your selected school district with another school district, county, city/place, state, metro, congressional district or the U.S. In the registration form text area, specify the state, school district and two other comparison areas (areas must be 20,000 population or more). We will generate the demographic profile and make it available electronically. The content of the profile will appear similar to the one shown in the example presented below. Optionally, install the Proximity GeoDemographic Information System on your computer and flexibly create profiles and perform other types of analyses with these and related data. Example Click this link to open an Excel file that shows a sample Comparative Analysis Demographic Profile. This profile includes a school district, congressional district and county in the Houston, TX area and Texas state summary data. The graphic presented below shows a small portion of the Excel file. 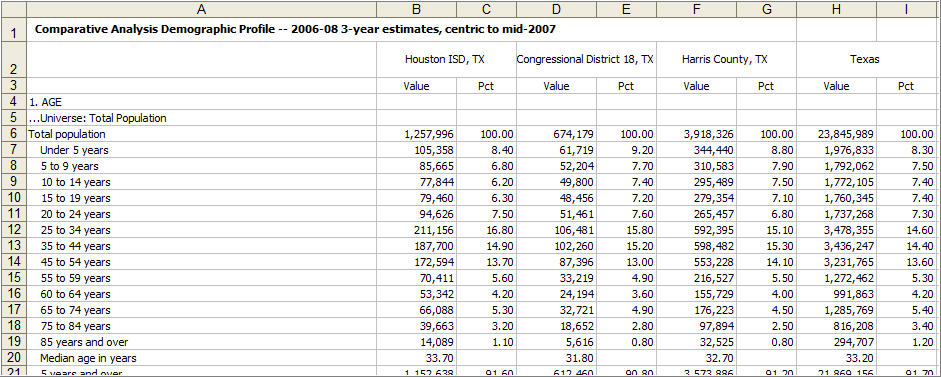
Scope of Demographic Data
The demographic data are organized by table. The tables are listed in the panel at the right. Tables 1 through 4 comprise the General Demographics. Does one area, compared to another, have a relatively higher/lower number of persons that are school age? aging population? Tables 5 through 15 comprise the Economic Characteristics Profile. The household income tells you about the number of households by income level plus related measures. Poverty status details provide insights into the relative economic prosperity. Find out more about how income is generated and how this compares to related areas. Employment by industry data tells you about the industrial composition of the workforce by type of business. Tables 16 through 29 comprise the Social Characteristics Profile. Learn how the population is enrolled in school and the levels of educational attainment ... is an area of interest lagging or leading? What is the mobility of the population? What is the distribution of native versus foreign born population? How well is English spoken in one area compared to another? Tables 30 through 39 comprise the Housing Characteristics Profile. Learn about owner versus renter composition. How do owner/vacancy patterns in one area compare to another area. What is the age of the housing stock and what does this tell you about housing infrastructure needs? Find out about home values in one area compared to others. What are costs of home ownership? Data Sources and Updates These profiles are based on the "2006-2008 3-year estimates" from the Census Bureau 2008 American Community Survey (ACS) which became available in late 2009. The profiles will be updated in late 2010 with "2007-2009 3-year estimates" (areas 20,000 population and over) and "2005-2009 5-year estimates" (all geographic areas to the block group level of geography). Proximity develops current demographic estimates and projections for this scope of subject matter. See the 3-year calendar at http://proximityone.com/cen2010.htm that summaries release dates for the Census 2010, ACS and Proximity estimates and projections. The "2006-2008 3-year estimates" are estimates based on a survey of respondents conducted over the period 2006 through 2008. The estimates are centric to mid-2007 but do not reflect estimates for a specific point in time. Collecting/tabulating data over a 3 year period provides sufficient respondent data to develop reliable estimates for geographic areas 20,000 population or more. Additional Information Proximity develops geodemographic-economic data and analytical tools and helps organizations knit together and use diverse data in a decision-making and analytical framework. We develop custom demographic/economic estimates and projections, develop geographic and geocoded address files, and assist with impact and geospatial analyses. Wide-ranging organizations use our tools (software, data, methodologies) to analyze their own data integrated with other data. Contact Proximity (888-364-7656) with questions about data covered in this section or to discuss custom estimates, projections or analyses for your areas of interest. Proximity provides School District geodemographic information to assist stakeholders in analysis of wide-ranging issues. We develop specialized demographic profiles, rankings, focused studies, projections, impact analyses and/or tools that you can use to address topics of interest to you. |
|
|