|
|
|
Characteristics of the Largest 25 U.S. School Districts
As of April 2000, the largest 25 U.S. school districts had approximately 670,000 relevant children who were not enrolled in school. The not-enrolled school age population is most certainly "left behind" and, in most cases, not included in the No Child Left Behind assessments. Not only are these school age children generally left out education programs, the impact of the 'not-enrolled school age population' can have a dramatic impact on the district and communities in which they are located. As shown in the data presented below, some of the larger districts have more than 15-percent of the relevant children in their district in this category. Adverse impacts of this group include family/household difficulties; increased potential for crime, poverty, and undesirable societal impacts; deterioration of the magnitude and quality of workforce; and evolvement of a relatively less educated society. The following table presents a summary of K-12 school age population by type of enrollment for the largest 25 U.S. school districts and total/all U.S. school districts based on the Census 2000 school district special tabulation (see data notes).
In the above table, 'Relevant Children Enrolled in Public School' is most closely associated with public school enrollment data collected and reported annually by school districts. Other items in this table are not available from any other source. Total relevant children account for 80.3 percent of the total children residing in these school districts. In this case, the difference is generally the sum of persons age less than 1, 1 year, and 2 years of age (population these ages are not included un the total [grade] relevant definition). Of the total relevant population, 75.9 percent are enrolled in public school, and 15.8 percent of the total relevant children are enrolled in private school. 8.3 percent of the total relevant children are not enrolled -- these are school age population who are grade relevant to the school district and not enrolled in school. These data are not ratio-based or otherwise estimated using a model or algorithm. The data are tabulations of individual respondent data -- a special tabulation of the Census 2000 long form questionnaire responses. In general, these tabulations follow the same rules for reliability as for the Census 2000 Summary File 3 data. Ranking of Largest Districts. The following table shows the largest 25 U.S. school districts ranked in descending order based on total relevant population. 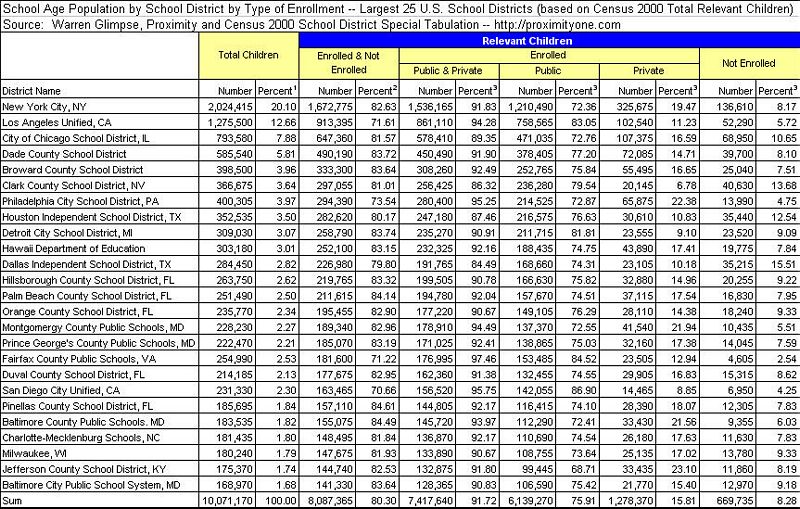
Relating Census Data to Reported Data. The following table shows the largest 25 U.S. school districts, again ranked in descending order based on total relevant population. This table presents the annual reported public school enrollment for the five years 1997-1998 through 2001-2002 and rate of change over this period. The next three columns show Census 2000 relevant population and the adjustment to relevant population removing relevant population ages 3 and 4 to enable a more accurate comparison with the corresponding 1999-2000 administratively reported data. In most districts the Census 2000 estimated public school enrollment ages 5 and over exceeds the administratively reported data values. 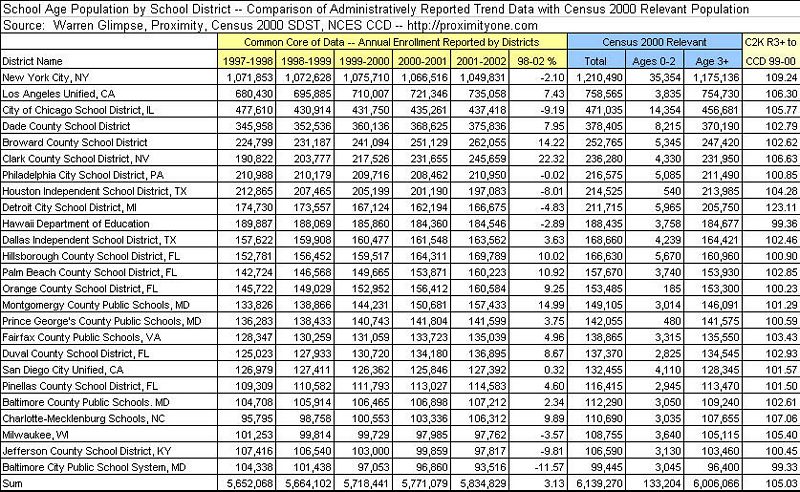
Interpretation Topics Comparing CCD and Census 2000 Data. The Common Core of Data (CCD) comparison year is the 1999-2000 school year. Data reflect enrollment as of the fall 1999. The CCD data are reported based on actual registrations. The error potential primarily derives from errors in capturing or summarizing the data. The Census 2000 data are as of April 2000. There is roughly a 6-month difference in the measurement time-frame of the 1999-2000 CCD data and the Census 2000 data. The estimates from Census 2000 are subject to errors of estimation. The impact of this error is nominal for universe sizes of the largest 25 school districts. Data from Census 2000 is for the resident population. Some residents of some districts might attend school outside of their district of residence. School District Geography. Of the largest 25 districts, Clark County, NV (Las Vegas) has the highest rate of change (22%) between 1999-2000 and 2001-2002 school years. Use of these change magnitudes must be carefully interpreted. They do not really tell the full story of 'district related' size and growth due to the irregular way that districts are defined from state to state. For example, since there are 50 districts in Maricopa County, Arizona, taken separately they do not appear in the set of the largest 25 districts. Yet in the contiguous composite of districts in that county, the growth would be much greater than the growth in Clark County, NV which is among the highest in the 25 largest districts. Definitions School Age Population Universes Table 1 shows column sets of data. The data column sets correspond to "type of enrollment record/universes of tabulation." 1. Total Children 2. Relevant Children – Enrolled and Not Enrolled 3. Relevant Children – Enrolled (Public and Private) 4. Relevant Children – Enrolled Public 5. Relevant Children – Enrolled Private 6. Relevant Children - Not Enrolled These universes are further described in the school district special tabulation general description. Total children definition. The 2000 SDST defines a child as a person age 0 to 17 (as of April 1, 2000) or a person age 18 or 19 who is not a high school graduate (based on the educational attainment response from the Census 2000 questionnaire). Relevant children definition. A child is relevant to a school district if he/she lives within the territory of the district and his/her assigned grade falls within the grade range provided by a district. Resources and Analyses Proximity provides comprehensive services to make use of these data: online access to the data for analytical use, the underlying database files for use on your computer, integration of these data with other-sourced data, software to perform custom structured displays and analysis, training and presentations on use of the data, and analyses of these data. Data Notes for Summary Table of School Age Children by Type of Enrollment All data are inclusive of the 50 states and D.C. There are 14,406 school district areas for which data were tabulated in the Census 2000 school district special tabulation. Of this number, data were tabulated for "children's own" characteristics (of which relevant population tabulations are a subset) for 13,558 school district areas. The difference, 848 school districts, are school districts having less than 50 total children -- the minimum threshold established to maintain confidentiality. "Children's own" data were not tabulated for districts with less than 50 children. The impact on the total population analyses resulting from omission of these small districts is negligible as the potential maximum total children for the aggregate of all 848 districts is 42,400 persons (848 times 50). Additional Information Proximity develops geodemographic-economic data and analytical tools and helps organizations knit together and use diverse data in a decision-making and analytical framework. We develop custom demographic/economic estimates and projections, develop geographic and geocoded address files, and assist with impact and geospatial analyses. Wide-ranging organizations use our tools (software, data, methodologies) to analyze their own data integrated with other data. Contact Proximity (888-364-7656) with questions about data covered in this section or to discuss custom estimates, projections or analyses for your areas of interest. |
|||||||||||||||||||||||||||||||||||||||||||
|
|