|
|
Population Projections Census 2000 & Demographic Updates |
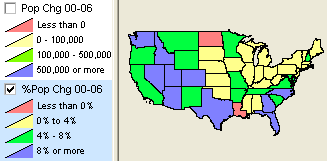
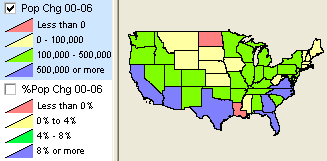
Latest Official State Population Estimates Each December, the Census Bureau releases new annual estimates of state population as of July 1 in the same year. Based on estimates released in December 2006, the nationís population grew by 1.0 percent (2.9 million people) between July 1, 2005, and July 1, 2006, to 299.4 million. Importance and Interpretation. Annual state level population estimates are developed using a component method where the July 1 population of the estimation year (2006) is computed as the sum of the previous year July 1 population estimate plus births, less deaths, plus net migration. This population estimation method creates the most accurate population estimate (short of direct enumeration). The July 1, 2006 estimates can be developed no earlier in the year as the required components (births, deaths, migration) are not available until December of the current estimation year. The annual state estimates provide us with an update on how the population size and distribution are changing within the U.S. The state estimates are also the first step in developing the sub-state estimates (county, place and other areas) that become available in the subsequent year. In the spring 2007, the first July 1, 2006 county level estimates will become available. Using the Data. The all U.S. by state estimates are included in the statepopest06.dbf which can be opened with Excel. CommunityViewer users can create maps such as those presented below by expanding the statepopest06.zip project file to c:\cv1\mapfiles and then opening the project file statepopest06.gpr in that folder.  State Population Percent Change 2000-2006 (lower legend section)
Arizona was the nationís fastest-growing state, 2005-06, with population increasing by 3.6 percent. Nevada ranked second this time,as its population climbed by 3.5 percent, followed by Idaho (2.6 percent), Georgia (2.6 percent) and Texas (2.5 percent).  State Population Change 2000-2006 (upper legend section)
California remains the most populous state with a population of 36.5 million on July 1, 2006, followed by Texas (23.5 million), New York (19.3 million), Florida (18.1 million) and Illinois (12.8 million). Other highlights:
|
|||||||||||||||||||||||||||||||||||||||||||||||||||||||||||||||||||||||||||
|
|