|
|
Texas School Districts by TAKS 2003 Scores
This information has been updated with TAKS 2006 results.
See http://proximityone.com/taks2006.htm
Access School District Demographics
for Your Districts of Interest
|
View maps and demographic profiles
(links in left column of that Web page) for individual Texas school districts.
|
Thematic maps offer a way to obtain a visual understanding of Texas
school district performance relationships based on the Texas Assessment of Knowledge and Skills (TAKS).
The TAKS tests are taken by most Texas public school students in spring of each year during grades 3-11.
The Texas Education Agency (TEA) provides detailed information as to how each
public and charter school in Texas performed on the 2003 TAKS via the Website
http://www.tea.state.tx.us/student.assessment/reporting/.
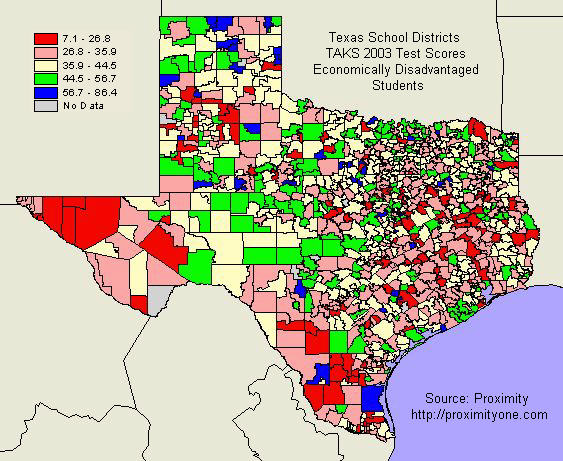
Texas School Districts
Economically Disadvantaged Students
TAKS 2003 All Tests
|
|
Despite the great detail of data available in tabular form, it remains difficult to understand
how districts in different geographic areas performed, and how different categories of
students performed on a regional basis. Maps help us see these relationships more easily than tables.
Data presented in maps referenced here are based on the Texas Assessment of Knowledge and Skills
2003 test for grades 3-11 at the Panel Recommended performance level.
These data are used to assess how school districts are improving, or not, by grade and subjects.
Data from these results are used to help evaluate and plan instruction for the coming school year.
Using the Maps.
Thematic maps make use of legends that show classifications of the data by intervals.
Intervals may be defined differently to aid in the interpretation of data presented.
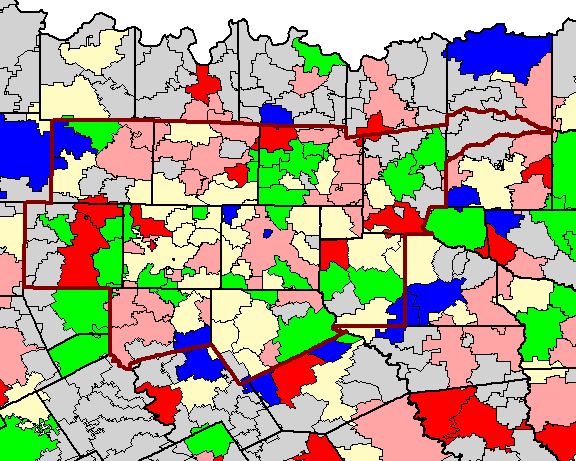
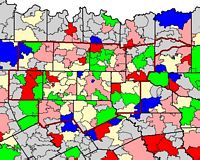
Dallas-Ft. Worth MSA Area Districts
Limited English Proficiency Students
TAKS 2003 All Tests
|
|
Two types of data intervals are used for each type of map (student classifications): fixed intervals
and natural break intervals.
The "fixed interval" classification set breakpoints in a manner meaningful to classifying the students by performance. The intervals on the second set of maps are set in a manner similar to the Accountability Rating System for the previous TAAS test, where 90 and above is Exemplary, 80 to 90 is the Recognized level of performance, test scores between 60 and 80 Acceptable performance. Test scores below 60 are divided into two categories � 40 to 60, and 40 and
below showing the poorest level of performance.
The "natural break" classification identifies breakpoints between classes using a
statistical formula (Jenk�s optimization).
This method is technically complex and involves the Jenk�s method that
minimizes the sum of the variance within each of the classes.
Use of natural breaks finds groupings and patterns inherent in the data.
School District Performance and Economic Development.
Quality schools are an important element to successful economic development programs.
Businesses and households are interested in locating in areas with good schools.
Geographic information systems and school system performance data provide insights
into relationships between school districts and county areas that are difficult to assess
with other tools.
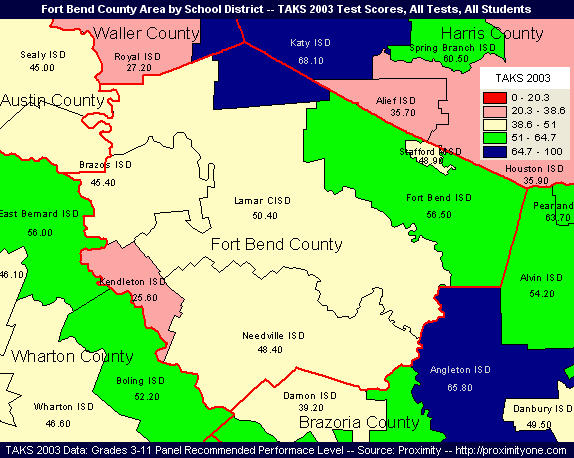
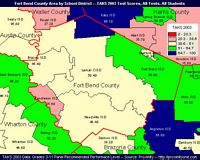
Fort Bend County Area by School District
TAKS 2003 All Tests
|
|
The map at the right shows the Fort Bend County, Texas area by school districts
(red lines are county boundaries). Using this type of map generated by the GIS, it is easy to compare
the performance of districts in the County and adjacent school districts.
In this example, the TAKS 2003 all tests, all students data are used for the grades 3-11 at the Panel Recommended performance level.
Click on the thumbnail view and expand the new window for a closer look.
A few key details are evident.
- In the Fort Bend County area, Lamar CISD is the most central
school district to the County and is the largest district in the County based on geographic area.
- Brazos ISD and Katy ISD are both partly contained in Fort Bend County and co-located in other
counties.
- Katy ISD has the highest school district performance, based on this measure.
- Outside of County, but contiguous Brazoria County, Angleton ISD has the second highest
school district performance score in the Fort Bend County area.
School district performance measures have inherently
limited, though important, "inferential use" for economic development.
Test score data are one type of measure in a set of key indicators that needs to be assessed to
track, examine or help facilitate economic development.
The real power of the GIS resource is enabled when this "map layer" (school district by test score)
is used with other types of demographic and economic measures.
In addition, using the GIS resources, it becomes easier to "drill down" a) by geography
(such as census tract) and b) by subject matter (such as alternative test universe tabulations).
Demographic Factors Affecting Performance.
Counties, cities, and school district areas can be subdivided into census blocks and block groups
to gain further insights into their internal composition.
Census block groups (BGs) are the smallest geographic area for which "richer demographics" are tabulated.
There are 14,482 BGs in Texas.
By using these data, insights can be gained into why some districts have higher TAKS test scores than
others. Lower test scores are not a good indicator of poorer instructional programs nor poor educational
opportunities for students in districts with lower scores.
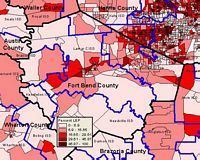
Fort Bend County Area by Block Group
Percent Limited English Proficiency
|
|
The map at the right shows the Fort Bend County, Texas area by school district (blue outline)
with a thematic overlay of the total population with limited English proficiency by block group
based on Census 2000 data. Counties appear with black boundaries.
As shown in the map presented above, Alief ISD has a cumulative TAKS test score than places it on the
lower end of the scale. By looking at the map at the right (click to expand and then expand that browser
window for the best view of detail), it is clear that Alief ISD has a relatively
high percent of the population who have limited English proficiency (LEP).
Very possibly, were programs to be augmented and successful at raising the level of percent LEP,
the school district performance scores would rise as well.
goto top
|