|
|
|
Texas School District Performance Analysis -- Comparative Analysis Profiles This page provides information regarding the TXSDP Comparative Analysis Profiles. The School District Performance Analysis (SDPA) software is a separate program and database that enables you to create performance profiles based on the TAKS 2005 and TAKS 2006 data for school districts that you select. SDPA enables you to easily compare 2, 3 or many peer or regional districts in side-by-side columns. SDPA is a part of the TXSDP Package. Example. Using the CommunityViewer GIS and TXSDP Project file, the following map is displayed showing Northwest ISD and adjacent districts with the state school district codes as labels. 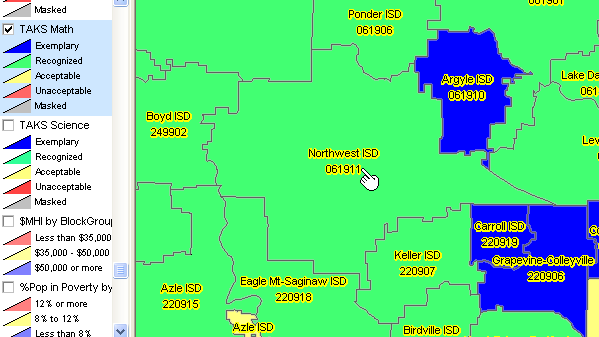
Using the SDPA software, the performance comparative analysis profiles are displayed for Northwest ISD and three adjacent districts. 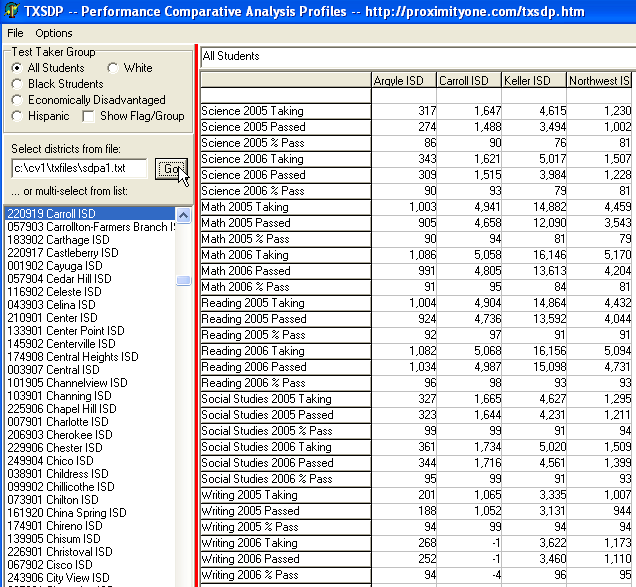
The profile is generated instantaneously. The above profile is for all students. Other student groups can be selected using the radiobutton selection at the left. One district can be displayed by dbl-clicking a school district name in the left column or a set of districts can be displayed (based on a file list or set of manually, multi-selected districts). You can see the 2006 math passing rate values in the map. By combining the comparative analysis tabular view with the map view provides improved capabilities to analyze performance. 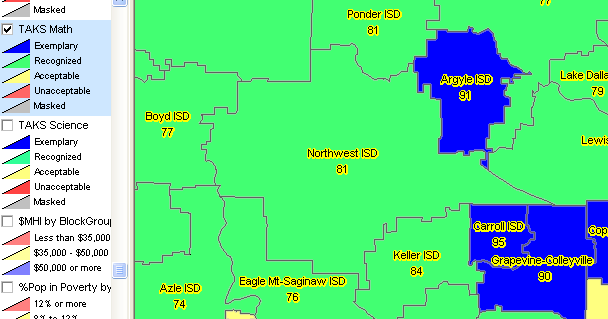
See the TXSDP User's Guide for more information. goto top |
|
|