
|
|
|
Texas School/School District Performance Analysis ... improving school performance and educational opportunities & opportunities
Use the Texas School District GeoDemographic Information System (SDGIS) with integrated performance data to: • visually analyze school & school district performance patterns • view characteristics of schools by neighborhood • analyze performance patterns in context of wide ranging demographics • set student/school/district performance goals for the year ahead ... add modeling features; examine impact of performance improvement tools. ... knit together projected performance data with other data in TXSDP. • add your data with security & privacy on your computer. ... geocoded student-level data with student attributes including test scores. ... tax parcels, subdivisions, roads/transportation routing, environmental features. • use visually-based collaborative tools for more effective decision-making • quickly compare/contrast schools, districts and regions Texas School/School District Performance (TXSDP) Use the ProximityOne Texas School/School District Performance (TXSDP) resources to help meet these needs. TXSDP provides Geographic Information System (GIS) mapping and geospatial analysis tools that enable integration of test/performance data with related demographic and geographic data. TXSDP includes detailed TAKS 2011 test/performance data by grade by school and district. Demographics include data from Census 2010, American Community Survey and ProximityOne estimates and projections. By integrating broader demographics with test/performance data, administrators, analysts and stakeholders can get a better understanding of the needs and opportunities for students and households for school attendance zones and other types of community and regional geographies. Geographic data in the form of shapefiles for metro, congressional districts, city/places, counties, census tracts, ZIP codes and infrastructure such as roads, railroads, water, among others, enable more holistic analysis of students and their living/learning environment. The ProximityOne program includes the Texas Assessment of Knowledge and Skills (TAKS) 2011 data and will progressively include State of Texas Assessments of Academic Readiness (STAAR) test data in subsequent years. Other geography Selected cities/districts, regions applications ... pattern analysis and mapping application examples: • Austin Metro -- http://proximityone.com/txsdp3_austin.htm • Houston Metro -- http://proximityone.com/txsdp3_houston.htm • Dallas Metro/Plano -- below, in this section Scope of Subject Matter Texas students are tested in grades 3 through 11. Texas statewide datasets and shapefiles have been developed for schools and school districts for each grade. See the related section for reference information and subject matter items included in the Texas Assessment of Knowledge and Skills (TAKS) 2011 datasets and shapefiles. Illustrative Applications Performance Patterns: Percent Grade 11 Student Test-takers who Met Standard by District: TAKS 2011 ... see related drill-down view North Dallas region with schools ... see blue highlighted legend section (at left in graphic) for interval/color definitions ... illustrates use of identify tool to show partial mini-profile for selected district (Houston ISD) 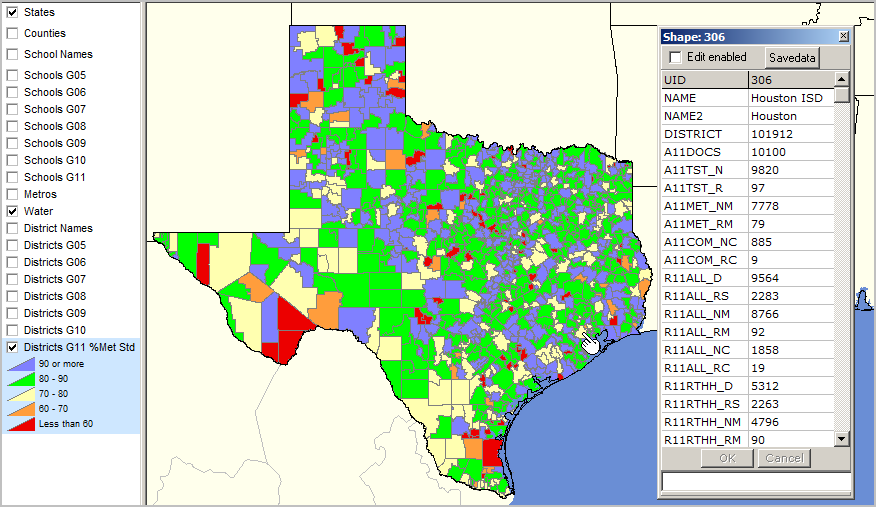
The Texas School/School District Performance package (TX SDGIS) (integrated software and database files) is available for downloading and use on Windows-based computers. Register here and mention TXSDP in text section. Despite the great detail of data available in tabular form, it remains difficult to understand how districts in different geographic areas performed, and how different categories of students performed on a regional basis. Maps can often help understand these relationships more easily than tables. Benefits and Applications Using these tools, you can answer questions such as:
Thematic maps make use of legends that show classifications of the data by intervals. Intervals may be defined differently to aid in the interpretation of data presented. School/School District Performance and Economic Development Quality schools are an important element to successful economic development programs. Businesses and households are interested in locating in areas with good schools. Geographic information systems and school system performance data provide insights into relationships between school districts and county areas that are difficult to assess with other tools. School district performance measures have inherently limited, though important, "inferential use" for economic development. Test score data are one type of measure in a set of key indicators that needs to be assessed to track, examine or help facilitate economic development. The real power of the GIS is enabled when this "map layer" (school district by test score) is used with other types of demographic and economic measures. In addition, using the GIS, it becomes easier to "drill down" a) by geography (such as census tract) and b) by subject matter (such as alternative test universe tabulations). Demographic Factors Affecting Performance Counties, cities, and school district areas can be subdivided into census blocks, block groups and census tracts (among others) to gain further insights into their internal composition. Census block groups (BGs) are the smallest geographic area for which "richer demographics" are tabulated. There are 14,482 BGs in Texas. The TAKS project files are provided with a Texas by block group (areas averaging 1,000 population) demographics file and a Texas by census tracts (areas averaging 4,000 population and groups of block groups) demographics file. The start-up view of the block groups layer uses median household income as a measure of economic prosperity. The start-up view of the census tracts layer uses percent population in poverty as a challenge factor measure. The subject matter selection and intervals may be changed. By using the block group and census tract demographics data, insights can be gained into why some districts have higher TAKS test scores than others. Lower test scores are not a good indicator of poorer instructional programs nor poor educational opportunities for students in districts with lower scores. Next Steps Methods and tools described here provide an effective way to assess school district performance, in the context of demographics, for any Texas school district or region and how that district or region compares to others. These same tools can be used to "drill down" to one or a set of schools. To do this requires the geocoding of student data so that the student level data can be integrated with the other geospatial data. By representing geocoded students as points or marker on a map, patterns can be revealed and help identify actions that can be taken to improve performance at the student, class and school level. How do you assess the impact of student mobility on performance? Students entering the district, moving out of the district or moving within the district can result in confusing data when viewed as counts or tables. Analyze changing patterns by viewing student markers on maps. Better understand where and how change is taking place. Identify ways to modify and manage programs to more effectively improve student/school performance. Additional Illustrative Views Plano ISD - North Dallas Area Percent All TAKS 2011 Test-takers who Met Standard by School (markers) ... with educational attainment (%H.S. graduates of population 25+ yrs) by census tract. ... school district boundaries bold black outline; school districts labeled with name. ... see legend section (at left in graphic) for interval/color definitions ... identify tool (see pointer/hand) used to show partial mini-profile for selected school. ... patterns reflect lower educational attainment of broader population associated with lower school performance. 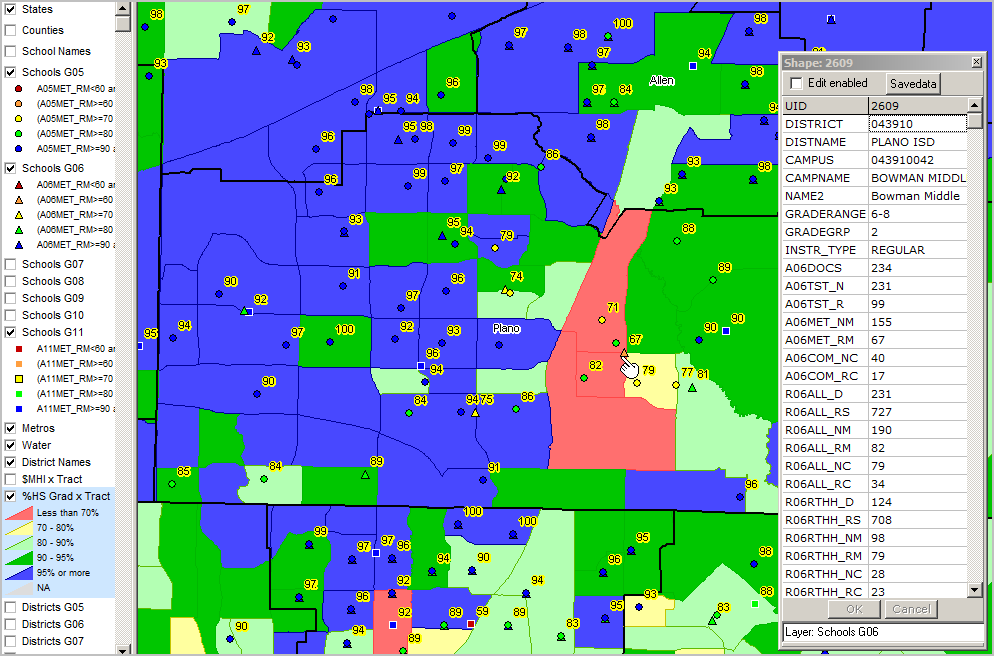
Support Using these Resources .. goto top Learn more about accessing and using demographic-economic data and related analytical tools. Join us in a Data Analytics Lab session. There is no fee for these one-hour Web sessions. Each informal session is focused on a specific topic. The open structure also provides for Q&A and discussion of application issues of interest to participants. ProximityOne User Group Join the ProximityOne User Group to keep up-to-date with new developments relating to metros and component geography decision-making information resources. Receive updates and access to tools and resources available only to members. Use this form to join the User Group. Additional Information ProximityOne develops geodemographic-economic data and analytical tools and helps organizations knit together and use diverse data in a decision-making and analytical framework. We develop custom demographic/economic estimates and projections, develop geographic and geocoded address files, and assist with impact and geospatial analyses. Wide-ranging organizations use our tools (software, data, methodologies) to analyze their own data integrated with other data. Follow ProximityOne on Twitter at www.twitter.com/proximityone. Contact us (888-364-7656) with questions about data covered in this section or to discuss custom estimates, projections or analyses for your areas of interest. |
|
|