|
|
|
Texas School/School District Performance Project 3 -- Houston Area
TXSDP3 - Houston Start-up View The graphic presented below shows the Texas School/School District Performance "Project 3" (TXSDP3) start-up view when the TXSDP3-Houston project is opened with the CommunityViewer (CV) GIS software. Use the TXSDP3-Houston project on your computer ... • Save TXSDP3-Houston project to folder c:\txsdp. • With CV running, use File>Open and open c:\txsdp\txsdp3_houston.gpr. • Requires base TXSDP3 project files ... contact us for details (mention TXSDP) Examining Characteristics of the Houston Area Click on the graphic at lower right to view a narrated video showing use of TXSDP for schools and school districts in the Houston area. Map Graphic showing Houston Metro The graphic presented below shows a zoom-in view to Houston metro. School districts are shown with bold black boundaries. The thematic pattern shows percent population age 25 years and over who are high school graduates by census tract. Labels show grade 11 % all test takers who met standard by school. The identify tool is used to show a profile for a selected school (see pointer). The profile shows attributes for this school. When the project is active on your computer, you can click on/off the tracts layer and view districts ... selectively click on/off school layers ... optionally change labeling ... optionally select other performance measures ... zoom to areas of interest ... add other types of data and geography. Click on graphic at right to view a narrated video of using TXSDP in the Houston area. 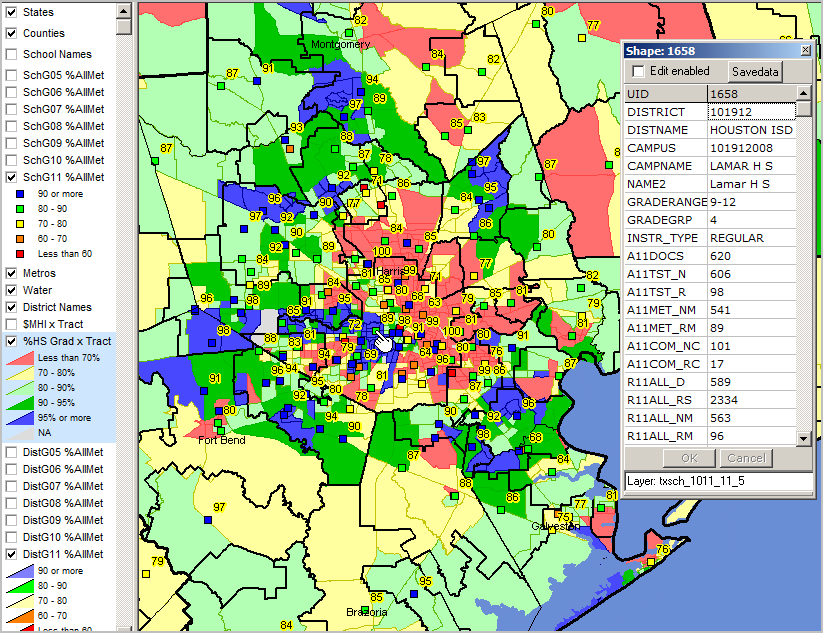
About ProximityOne ProximityOne develops geographic-demographic-economic data and analytical tools and helps organizations knit together and use diverse data in a decision-making and analytical framework. We develop custom demographic/economic estimates and projections, develop geographic and geocoded address files, and assist with impact and geospatial analyses. Wide-ranging organizations use our tools (software, data, methodologies) to analyze their own data integrated with other data. Contact us (888-364-7656) with questions or for additional information. |
|
|
