|
|
|
Texas School/School District Performance Project 3 -- TXSDP3 Structure, Content & Use
TXSDP3 Start-up View The graphic presented below shows the Texas School/School District Performance "Project 3" (TXSDP3) start-up view when the TXSDP3 project is opened with the CommunityViewer (CV) GIS software. This view shows an area in the northern counties of the Dallas, TX metro. See interpretative description of the map graphic shown below following the graphic. See related notes further down in this section about how you can use these tools. See variations on the TXSDP3 project for selected cities/districts, regions: • Austin Metro -- http://proximityone.com/txsdp3_austin.htm • Houston Metro -- http://proximityone.com/txsdp3_houston.htm 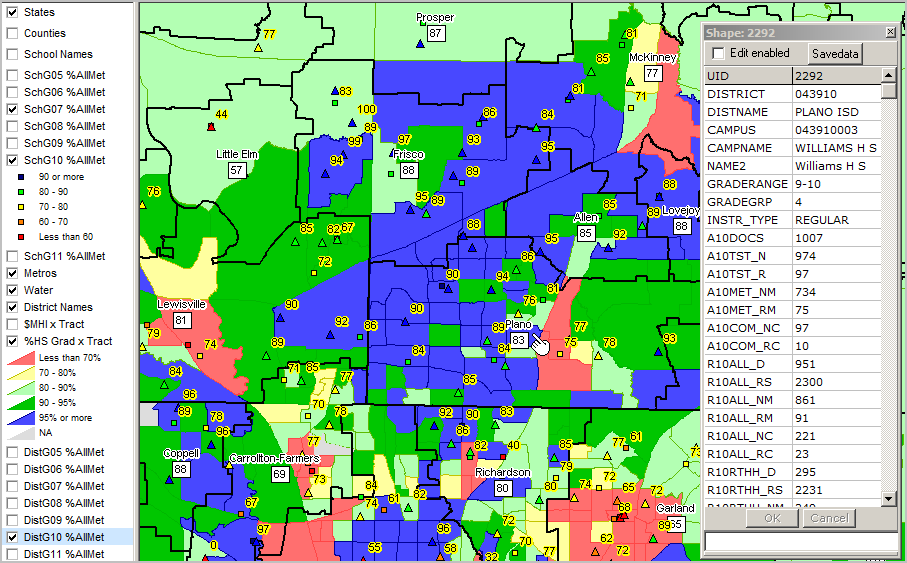
The view is comprised of the legend panel (left section) and map view window. The legend panel shows the layers (shapefiles) that may be shown as a map in the map view window. Layers in the legend panel that are checked (see checkbox by each layer) are shown in the map. In this view, layers checked include: • States - shows state boundaries - none in this zoom view. • SchG07 %AllMet - markers showing schools, representing all grade 7 TAKS 2011 test takers who met TAKS standard. • SchG10 %AllMet - markers showing schools, representing all grade 10 TAKS 2011 test takers who met TAKS standard. • Metros - metropolitan area boundaries - none shown in this zoom view. • Water - water area boundaries (coastal) - none shown in this zoom view. • District Names - school district names. • %HS Grad x Tract - percent high school graduates (based on 2009 ACS 5-year estimates) by census tract. • DistG10 %AllMet - school districts showing patterns of all grade 10 TAKS 2011 test takers who met TAKS standard. Locate the pointer/hand in the map • Area shown by the black bold boundary is the Plano ISD school district. • School districts are labeled with name (by District Names layer) ... grade 10 TAKS 2011 test takers who met TAKS standard (83 for Plano). • Colored areas are census tracts; colors represent educational attainment patterns. ... red indicates that less than 70 percent of the population ages 25 years and older are high school graduates. Square yellow marker to right of pointer/hand is Williams HS. • this school has TAKS 2011 all test takers percent met standard value of 75 percent. • CV identify used to display profile profile to right of map view. Using the TXSDP3 Project While this view is focused on the north Dallas area, a similar view can easily be shown for any district or region of interest. Learn how districts/schools of interest compare to other districts/schools/areas. Examine demographics of small areas and learn about the relationships that may exist between performance and demographics. Learn about success patterns that exist in other areas; examine how performance and educational opportunities can be enhanced. Get to these objectives through the following types of TXSDP use/operations: • Selectively check on/off layers of interest. • View all schools, schools with selected grade(s) or no schools. • View districts by selected grade or no districts. • Use the county layer to show district in context of county. • Change attribute being shown for schools or districts. ... start-up view shows only percent all test takers who met standard. ... choose from more than 100 subject matter categories. • Add your own data ... Census 2010, American Community Survey, economic development zones, tax parcels. ... examine a truly endless set of other data. Layers in this Project Expand or reduce the layers included in the project ... • States - U.S. by state boundaries/names • Counties - Texas county boundaries/names, selected attributes • School Names - school layer names • SchG05 %AllMet - schools (markers) - with attributes of grade 5 TAKS 2011 test takers • SchG06 %AllMet - schools (markers) - with attributes of grade 6 TAKS 2011 test takers • SchG07 %AllMet - schools (markers) - with attributes of grade 7 TAKS 2011 test takers • SchG08 %AllMet - schools (markers) - with attributes of grade 8 TAKS 2011 test takers • SchG09 %AllMet - schools (markers) - with attributes of grade 9 TAKS 2011 test takers • SchG10 %AllMet - schools (markers) - with attributes of grade 10 TAKS 2011 test takers • SchG11 %AllMet - schools (markers) - with attributes of grade 11 TAKS 2011 test takers • Metros - metropolitan areas • Water - water areas (coastal) • District Names - school districts layer names • %HS Grad x Tract - census tract areas - with mix of demographics, one being HS graduates • DistG05 %AllMet - school district areas - with attributes of grade 5 TAKS 2011 test takers • DistG06 %AllMet - school district areas - with attributes of grade 6 TAKS 2011 test takers • DistG07 %AllMet - school district areas - with attributes of grade 7 TAKS 2011 test takers • DistG08 %AllMet - school district areas - with attributes of grade 8 TAKS 2011 test takers • DistG09 %AllMet - school district areas - with attributes of grade 9 TAKS 2011 test takers • DistG10 %AllMet - school district areas - with attributes of grade 10 TAKS 2011 test takers • DistG11 %AllMet - school district areas - with attributes of grade 11 TAKS 2011 test takers About ProximityOne ProximityOne develops geographic-demographic-economic data and analytical tools and helps organizations knit together and use diverse data in a decision-making and analytical framework. We develop custom demographic/economic estimates and projections, develop geographic and geocoded address files, and assist with impact and geospatial analyses. Wide-ranging organizations use our tools (software, data, methodologies) to analyze their own data integrated with other data. Contact us (888-364-7656) with questions or for additional information. |
|
|