|
|
|
Texas School District Performance Analysis -- GIS Project Performance Settings This page provides information regarding the TXSDP CommunityViewer project layer settings. The preset values for the performance intervals are as follows: • Exemplary • Recognized • Acceptable • Unacceptable • Masked These settings are reflected in the legend panel at the left in the following view: 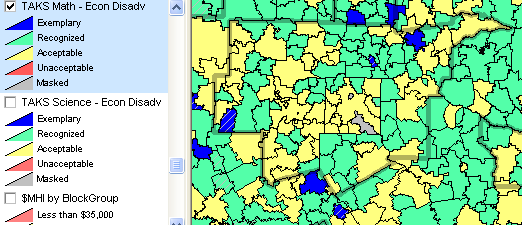
The above map is a zoom-in view of the Dallas-Fort Worth-Arlington, Texas MSA. The MSA layer has been clicked on so that the MSA boundaries appear. To understand what these settings mean, or to modify the settings, double-click the layer name and the layer editor appears. There are 5 intervals/sections defined for this layer. Each section and its settings are reviewed below. Interval 1 -- Exemplary 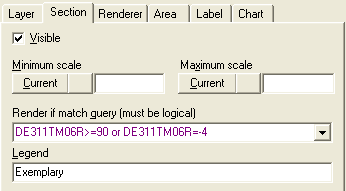
The following query is used to set the above interval: DE311TM06R>=90 or DE311TM06R=-4 "DE311TM06R" is the name of a field in the Texas school districts performance layer. These names have been assigned by the Texas Education Agency and are followed here. There are more than 200 of these types of performance field names. The entire set of field names in the school districts shapefile is contained in this Excel file: http://proximityone.com/taks/taks2006_sd_tx_fields.xls. Thus, the criteria for a school district to be considered Exemplary is that the value of the field DE311TM06R must be greater than or equal to 90 or the value of the field DE311TM06R must be equal to -4. The value -4 is the assigned by the TEA to a passing rate 99% to 100% passing. Using the Excel file, you can determine that DE311TM06R refers to: D -- district E -- economically disadvantaged 311T -- tests grades 3 through 11 M -- Math 06 -- 2006 test year R -- percentage rate Interval 2 -- Recognized 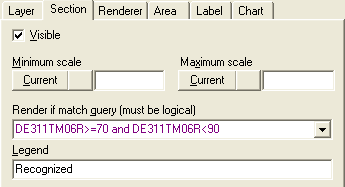
The query for the Recognized interval is: DE311TM06R>=70 and DE311TM06R<90 Similar to the field structure breakdown provided about interval 1, it can be seen that the field value for DE311TM06R must be greater than or equal to 70 and less than 90 for the corresponding school district to have a 'Recognized' rating. Interval 3 -- Acceptable (TEA refers to this as Academically Acceptable, shortened in the legend to Acceptable) 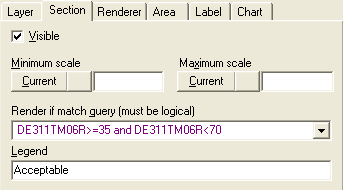
The query for the Academically Acceptable interval is: DE311TM06R>=35 and DE311TM06R<70 DE311TM06R must be greater than or equal to 35 and less than 70 for the corresponding school districtís math performance to be labeled Acceptable. [Note that in future years, this range will change, and the CV1 settings can be edited to reflect the changed range.] Interval 4 -- Unacceptable 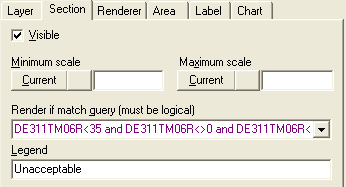
The query for the Academically Unacceptable interval is: DE311TM06R<35 and DE311TM06R<>0 and DE311TM06R<>-1 and DE311TM06R<>-4 If DE311TM06R is less than 35 percent passing, then the districtís math performance is deemed Unacceptable. The remainder of the query excludes rates of 0 and -1 and -4 from this interval because these are values that the TEA uses for small numbers tested, for performance near 0% and for performance near 100%, respectively. Interval 5 -- Masked 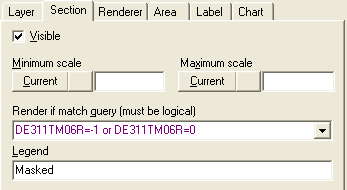
For student confidentiality reasons, some performance levels are masked with a -1 in the field. Also, values are not reported where there is a small number of test-takers, and a 0 appears in the field. This interval has been set so that a light grey appears on the map for these districts. goto top |
|
|