Metropolitan Areas

Contents
This section provides an example/tutorial on use of VDA to develop a custom map focused on 2020 Core-Based Statistical Areas/metros. See more about 2020 Core-Based Statistical Areas/Metros. Applications in this section can be developed using the no fee VDA Viewer as well as Levels 1, 2, 3. Use VDA installer to install VDA on your computer.
This view below shows the 2020 Core-Based Statistical Areas (CBSAs), focused on the Dallas metro, developed from scratch using the VDA GeoGateway feature.
The Layer Editor was used to create a query to render the Dallas CBSA with a bold boundary; other CBSAs with thin line boundary. The identify tool is used to click on the Dallas CBSA and display the mini-profile.
Use VDA tools to navigate to region/CBSA of interest. Add other layers; custom geography and subject matter.

To create the view above, or for an area of interest, first File>Close any open project.
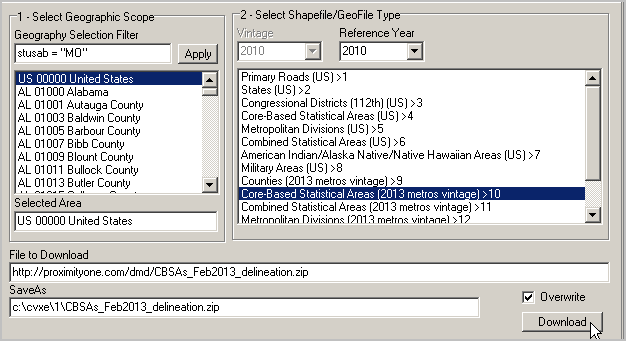
The 2013 CBSAs shapefile may be accessed via GeoGateway.
The GeoGateway feature is available to VDA Viewer and all VDA Level users. More about using GeoGateway.
Add the CBSA layer to the project. Initial view of all CBSAs added
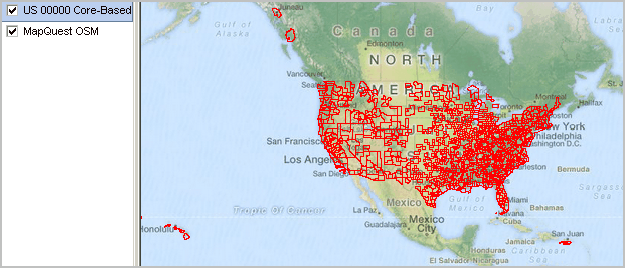
Close the GeoGateway form. The view shown at the top of this section was developed using the navigation tools and layer editor.
Schedule a One-to-One web meeting; get the results that are right for you.