Summary of Operations
Main Menu Operations. A summary of the operations that may be accessed or invoked from the main menu bar are listed in the VDA Feature Summary section.
Map View Navigation Operations. Primary map view navigation tools are 1) legend panel operations, and 2) zoom, pan/drag, previous view, full extent view, and refresh tools.
Legend Panel Operations
Enabling view of a layer. At start-up, all layers checked in the legend panel are displayed. Turn-on (make the layer visible) or turn-off a layer view by checking or un-checking the checkbox by the layer name.
Changing position of layer in map view. Layers listed in the legend panel have a “stacked” or “layered” relationship. A layer listed above another layer will appear “on top of” the lower layer.
Change the position of a layer in the layered view by clicking on the name of the layer in the legend panel and dragging the layer name up or down.
Making a layer active. To make a layer “active,” click on the layer name in the legend panel. The layer name section turns blue indicating that layer is the active layer.
Toolbar Operations
Among the Toolbar buttons are these navigation buttons: fullextent, zoom, pan/drag, and previous view.
Full Extent View. Click the globe on the tool bar to view the “full extent”. The full extent view is the view that shows full, or maximum, geographic scope of all geographic elements in shapefiles contained in the project. In the U.S. by County project, this results in a view of the northern hemisphere. Click MapView>Refresh to refresh to the original view.
Zoom Tool. Select the zoom tool (magnifying glass on toolbar). Envision a rectangle that you want to zoom to. To zoom-in, click left in the map at the upper left point of the rectangle, hold the mouse button down, drag the box to the lower right point of the rectangle, and release the mouse button. The zoom-in view appears.
Reverse this process to zoom out.
Pan/Drag Tool. Select the pan tool (use button at right of zoom button). Click left on the map, hold the mouse key down, and slide the map. Release the mouse button.
Previous View Tool. Select the previous view tool (use button at right of pan/drag button). Click on this button to return to the previous view. Only the immediate previous view history is available.
Map Window Operations
The Shape Viewer/Editor is used to show/view attributes of a selected shape (an object in a shapefile such as a selected county in U.S. county shapefile).
The attributes are the fields in the shapefile dbf and the values for the specific shape selected.
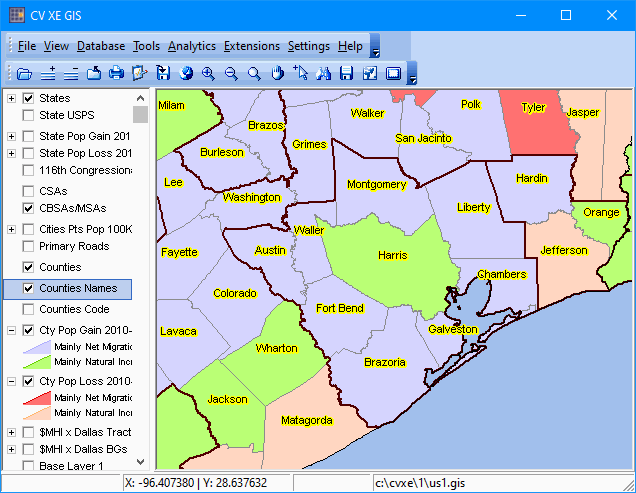
Use the Shape Viewer/Editor by 1) selecting the Select/Identify tool from the menu, 2) selecting a layer in the legend panel (the layer name turns blue) then 3) clicking a shape displayed in the Map Window. In the following graphic/example, the view is set to the Houston metro area. The Counties Names layer is selected.

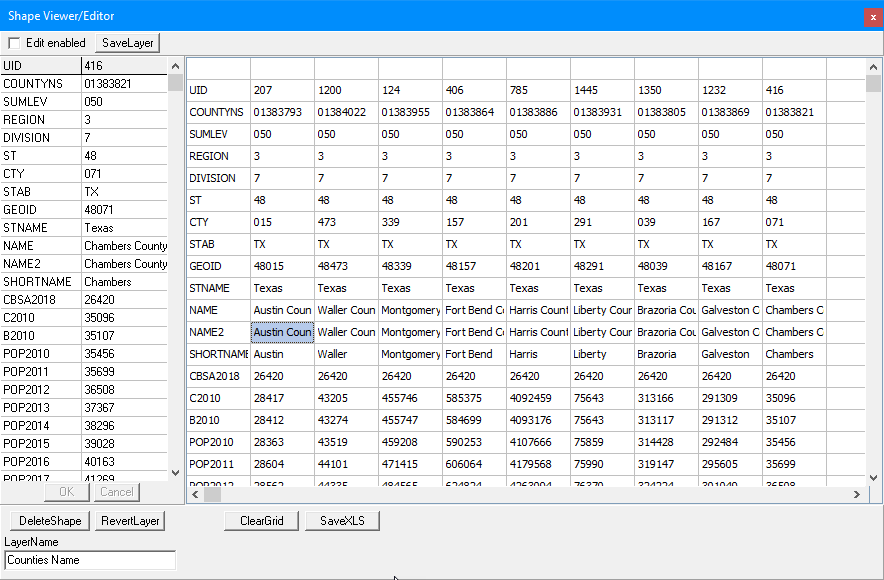
Each of the counties in the Houston metro are clicked. As they are clicked, the shapefile dbf values are pasted into a new column in the grid as shown below.

At the end of end of clicking the 9 component counties the Shape Viewer/Editor grid contains the content as above.
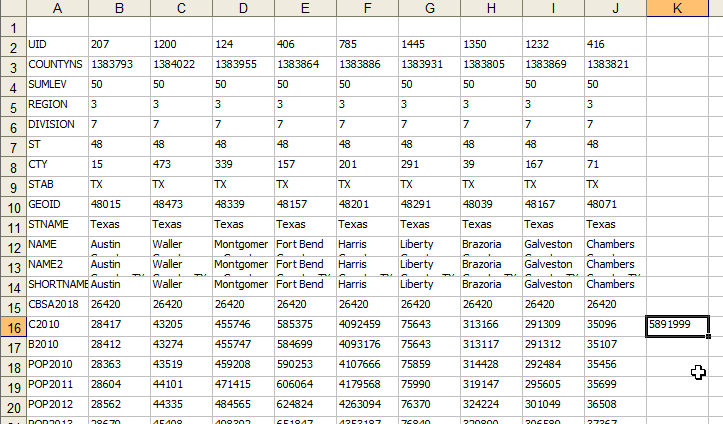
By clicking the Save XLS button below the table, the grid content is saved as an XLS file as shown below.
Opening the file using Excel or similar tool, the file may be operated on as a spreadsheet. In this example, the county values may be compared, converted to a graphic or manipulated in other ways. In this example, the county level attributes can be summed to derive the total metro values. This example illustrates summing the Census 2010 total population values to compute the 2018 vintage metro summary 5,891,999 total population.

