How Metro Demographics are Changing
The vintage 2023 935 Core-Based Statistical Areas (CBSAs) in the U.S. (925) and Puerto Rico (10) are comprised of Metropolitan Statistical Areas (MSAs) and Micropolitan Statistical Areas (MISAs). CBSAs are comprised of one or more contiguous counties as defined by OMB. The 935 core-based statistical areas currently defined by the OMB include the 393 MSAs, which have an urban core population of at least 50,000, and the 542 (MISAs), which have an urban core population of at least 10,000 but less than 50,000. See more about CBSAs.
In this section, you will learn to examine MSAs using iVDA with the "Base" project.
We will use the 2023 vintage metropolitan areas. See related interactive table.
iVDA is one part of a broader VDA GIS resource framework. See more about VDA GIS.
In the iVDA frame below, proceed as follows:
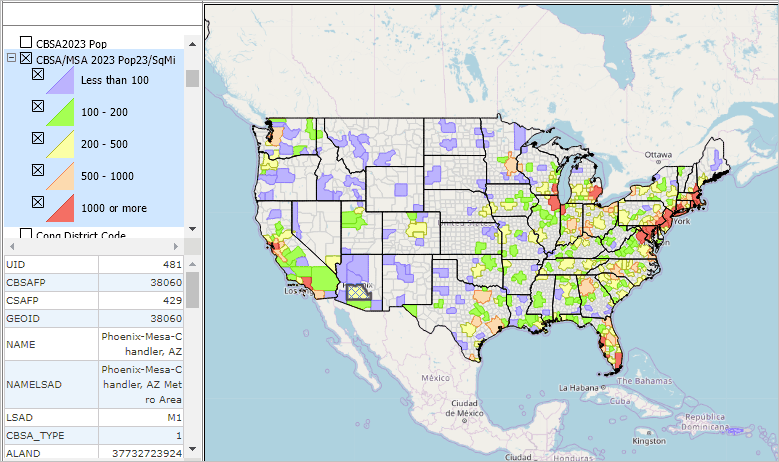
In the Legend Panel at the left of the Map Window, scroll down to "CBSA/MSA 2023 Pop23/SqMi" layer and check on.
.. click the + to left of name to expand the interval view
The map view refreshes to show a thematic pattern view of the 2023 population by square mile by MSA.
Click a MSA of interest in the map
.. a demographic profile for that MSA is displayed in the lower left.
.. here you can examine a wide range of demographic subject matter items.
Visual Data Analytics Web GIS
iVDA is presented below in an interactive mapping window .. watch video
Below is a static graphic example of using iVDA as described above.

