How City Population is Changing
Seven of the 10 fastest growing cities from 7/1/20 to 7/1/23, with 5,000 or more population, are in Texas. How are your cities of interest changing?
In this section, you will learn to examine your, or any, city population trends using iVDA with the "Base" project.
We will use the city and related layers. See related interactive table.
iVDA is one part of a broader VDA GIS resource framework. See more about VDA GIS.
Find a city based on an address/location
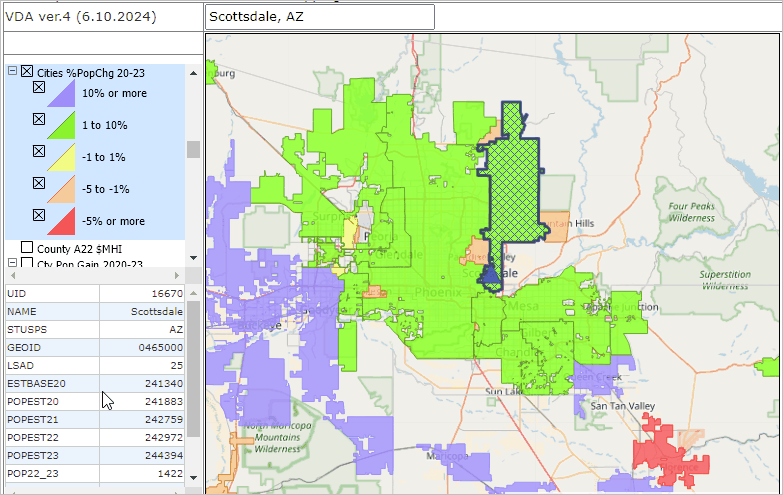
.. in the searchbar above the map enter an address city name and state like Scottsdale, AZ and press enter.
or address like 9451 N 84th St, Scottsdale, AZ 85258 or a zip code like 85258 and press enter.
.. the map view zooms-in to the city extent, places a blue triangle at the location.
the city demographic profile shows in the lower left panel
.. in the legend panel at left, scroll to "Cities %PopChg 20-23" and click the checkbox on
optionally zoom out to view other cities in the region.
.. uncheck the "States1" layer (last layer in legend panel) to view the topology.
Try your own city.
Visual Data Analytics Web GIS
iVDA is presented below in an interactive mapping window .. watch video
Below is a static graphic example of using iVDA as described above.

