
|
|
|
.. learn about city geographic, demographic, economic characteristics .. learn about how your cities of interest are changing September 2024 .. Cities are the primary drivers of the global economy, accounting for 70% of the world's GDP. They are centers for trade, commerce, productivity, and innovation, and offer employment, health and education services, and higher living standards. As cities' populations change, so does their potential for job creation, business opportunity, and investment. did you know .. that 801 of the 19,474 U.S. cities have 2023 population that exceeds 50,000 population. How many and which of these cities gained or lost population between 2020 and 2023? Find out for your areas of interest. The total 2023 population of all of 19,474 cities was 210,685,203, or 62.9 percent of the total U.S. population (334,914,895). More about these data. Extended data for cities. Terms of Use. In this Section • interactive mapping tool to locate/examine a city based on address/location. • interactive table to view, rank, compare, each/all cities. Examining Patterns of Population Growth by City within Metros ExUrban population growth rates are outpacing suburban area population growth rates for many metros. Neither suburban or exurban (the further out geography in a metro) geographies have formally defined geographic boundaries. But by examining city population growth in the exurbs reveals that exurban population is growing faster than cities in the suburbs. This is illustrated in the Dallas metro area graphic (blue colored cities outpacing green colored cities) shown below. Make maps similar to this one for your areas of interest using VDA GIS resources. 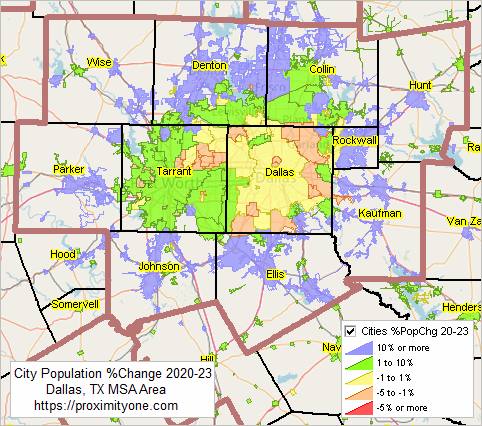 Mapping America's Cities -- Examine Cities of Interest .. using iVDA part of Visual Data Analytics .. more options available using VDAGIS Discovery The start-up view is presented below in an interactive mapping window .. watch video Locate a city .. see it on a map .. examine its demographics Click a box to view instructions. Find a City based on an address/location.. enter an address or location like "San Diego, CA" (no quotes, not case sensitive).. the map view zooms-in to the city containing the location and shows the city crosshatched. .. view the demographic profile for this city displayed in the lower left. .. here you can examine many demographic subject matter items for that city. .. optionally click on other layers in the Legend Panel. .. the address/location is shown by the blue marker .. this is in the city associated with the address/location used in the searchbar. .. see in the lower left panel the population was 1,386,960 in 2020 and 1,374,484 in 2023 .. for this city. .. try a different address or location, maybe the ZIP code "85258" or any address/location. .. the view will zoom to that city. Examine Urban/Rural Patterns.. in the Legend Panel, left of map, click "Urban Layers" ckeckbox on... the map refreshes showing urban areas with a orange/salmon fill pattern; areas not colored are rural. .. click on an urban area in map to view its attributes in lower left panel. .. hide this layer by unchecking the layer checkbox. Examine Patterns of Economic Prosperity by City.. in the Legend Panel, left of map, click "Tracts $MHI" ckeckbox on (scroll down in legend panel).click + icon to view legend interval colors/values. .. the map refreshes showing patterns of median household income ($MHI) based on legend intervals shown at left. .. hide this layer by unchecking the layer checkbox. Subject Matter Items in city profile .. from clipboard, pasted into XLSX. City Population & Population Change 2020-2023 -- interactive table .. goto top use mouse-over on header column to view extended item/column name. see usage notes below table. Usage Notes Use mouse-over on header column to view extended item/column name. Click ShowAll button to reset table. • View "Up to 5 Cities" .. enter 5 City codes in the 5 edit boxes then click button "Up to 5 Cities" .. the default selection of cities are in the north Dallas MSA; shown in graphic. 4827684 Frisco 4819972 Denton 4843012 Little Elm 4859696 Prosper 4813684 Celina Zoom-in to North Dallas MSA 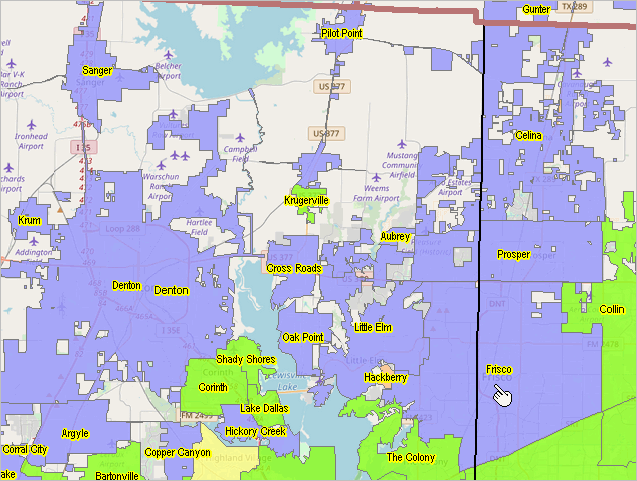 Table Column Descriptions CityName State USPS GeoID City Type Population Base2020 Population 2020 Population 2021 Population 2022 Population 2023 PopChg 22_23 %PopChg 22_23P PopChg 20_23 %PopChg 20_23P Land Area SqMi 2023 Water Area SqMi 2023 Population Density 2023 About the Data .. goto top Basic Data .. included in interactive mapping
City Name
USPS State GEOID LSAD Population 7/1/20 Population 7/1/21 Population 7/1/22 Population 7/1/23 Pop Chg 7/1/20-7/1/23 %Pop Chg 7/1/20-7/1/23 D001 Total Population D002 Male D003 Female D005 Under 5 Years D006 5 to 9 Years D007 10 to 14 Years D008 15 to 19 Years D009 20 to 24 Years D010 25 to 34 Years D011 35 to 44 Years D012 45 to 54 Years D013 55 to 59 Years D014 60 to 64 Years D015 65 to 74 Years D016 75 to 84 Years D017 85 Years and Over D018 Median age (years) D019 Under 18 years D020 16 years and over D021 18 years and over D022 21 years and over D023 62 years and over D024 65 years and over D036 One Race D037 One Race -- White D038 One Race -- Black or African American D039 One Race -- American Indian and Alaska Native D044 One Race -- Asian D052 One Race -- Native Hawaiian and Other Pacific Islander D057 One Race -- Some Other Race D058 Two or more races D073 Hispanic or Latino (of any race) D074 Hispanic or Latino (of any race) -- Mexican D078 Not Hispanic or Latino D079 Not Hispanic or Latino -- White Alone D080 Not Hispanic or Latino D088 Total housing units D089 Citizen 18 and Over Population D090 Citizen 18 and Over Population - Male D091 Citizen 18 and Over Population - Female S001 Total Households S002 Total Households -- Married-couple family S004 Total Households -- Cohabitating couple household S008 Total Households -- Householder living alone male S012 Total Households -- Householder living alone female S016 Average household size S017 Average family size S018 Population in Households S053 School Enrollment -- Population 3 Years and Over Enrolled in School S054 School Enrollment -- Population 3 Years and Over Enrolled in School -- Nursery School Preschool S055 School Enrollment -- Population 3 Years and Over Enrolled in School -- Kindergarten S056 School Enrollment -- Population 3 Years and Over Enrolled in School -- Elementary School (Grades 1-8) S057 School Enrollment -- Population 3 Years and Over Enrolled in School -- High School (Grades 9-12) S058 School Enrollment -- Population 3 Years and Over Enrolled in School -- College or Graduate School S059 Educational Attainment -- Population 25 Years and Over S060 Educational Attainment -- Population 25 Years and Over -- Less Than 9th Grade S061 Educational Attainment -- Population 25 Years and Over -- 9th to 12th Grade No Diploma S062 Educational Attainment -- Population 25 Years and Over -- High School Graduate (Includes Equivalency) S063 Educational Attainment -- Population 25 Years and Over -- Some College No Degree S064 Educational Attainment -- Population 25 Years and Over -- Associate's Degree S065 Educational Attainment -- Population 25 Years and Over -- Bachelor's Degree S066 Educational Attainment -- Population 25 Years and Over -- Graduate or Professional Degree S067 Educational Attainment -- Population 25 Years and Over -- Percent High School Graduate or Higher S068 Educational Attainment -- Population 25 Years and Over -- Percent Bachelor's Degree or Higher S079 Residence 1 Year Ago -- Population 1 Year and Over S080 Residence 1 Year Ago -- Same House S081 Residence 1 Year Ago -- Different House in the U.S. or abroad S082 Residence 1 Year Ago -- Different House in the U.S. S083 Residence 1 Year Ago -- Different House in the U.S. -- Same County S084 Residence 1 Year Ago -- Different House in the U.S. -- Different County S085 Residence 1 Year Ago -- Different House in the U.S. -- Different County -- Same State S086 Residence 1 Year Ago -- Different House in the U.S. -- Different County -- Different State S087 Residence 1 Year Ago -- Abroad S089 Place of Birth -- Native S090 Place of Birth -- Native -- Born in U.S. S091 Place of Birth -- Native -- Born in U.S. -- State of Residence S092 Place of Birth -- Native -- Born in U.S. -- Different State S093 Place of Birth -- Native -- Born in Puerto Rico U.S. Island Areas or Born Abroad to American Parents S094 Place of Birth -- Foreign Born S095 U.S. Citizenship Status -- Foreign-Born Population S096 U.S. Citizenship Status -- Foreign-Born Population -- Naturalized U.S. Citizen S097 U.S. Citizenship Status -- Foreign-Born Population -- Not a U.S. Citizen S112 Language Spoken at Home -- Population 5 Years+ S113 Language Spoken at Home -- Population 5 Years+ -- English Only S114 Language Spoken at Home -- Population 5 Years+ -- Language Other Than English S115 Language Spoken at Home -- Population 5 Years+ -- Language Other Than English -- Speak English Less Than Very Well S116 Language Spoken at Home -- Population 5 Years+ -- Language Other Than English -- Spanish S117 Language Spoken at Home -- Population 5 Years+ -- Language Other Than English -- Spanish -- Speak English Less Than Very Well S152 Computers and Internet Use -- Total Households S153 Computers and Internet Use -- Households with a Computer S154 Computers and Internet Use -- Households with a Broadband Internet Subscription E001 Employment Status -- Population 16 Years+ E002 Employment Status -- Population 16 Years+ -- in Labor Force E003 Employment Status -- Population 16 Years+ -- Civilian Labor Force E004 Employment Status -- Population 16 Years+ -- Employed E005 Employment Status -- Population 16 Years+ -- Unemployed E006 Employment Status -- Population 16 Years+ -- Armed Forces E007 Employment Status -- Population 16 Years+ -- Not in Labor Force E008 Employment Status -- Population 16 Years+ -- Civilian Labor Force E009 Employment Status -- Population 16 Years+ -- Percent Unemployed E026 Civilian Employed Population 16 Years+ E027 Occupation -- Civilian Employed Population 16 Years and Over -- Management business science and arts occupations E028 Occupation -- Service occupations E029 Occupation -- Sales and office occupations E030 Occupation -- Natural resources construction and maintenance occupations E031 Occupation -- Production transportation and material moving occupations E033 Industry -- Civilian Employed Population 16 Years+ -- Agriculture Forestry Fishing & Hunting & Mining E034 Industry -- Civilian Employed Population 16 Years+ -- Construction E035 Industry -- Civilian Employed Population 16 Years+ -- Manufacturing E036 Industry -- Civilian Employed Population 16 Years+ -- Wholesale Trade E037 Industry -- Civilian Employed Population 16 Years+ -- Retail Trade E038 Industry -- Civilian Employed Population 16 Years+ -- Transportation & Warehousing & Utilities E039 Industry -- Civilian Employed Population 16 Years+ -- Information E040 Industry -- Civilian Employed Population 16 Years+ -- Finance & Insurance & Real Estate & Rental & Leasing E041 Industry -- Civilian Employed Population 16 Years+ -- Professional Scientific & Management & Administrative & Waste Management Services E042 Industry -- Civilian Employed Population 16 Years+ -- Educational Services & Health Care & Social Assistance E043 Industry -- Civilian Employed Population 16 Years+ -- Arts Entertainment & Recreation & Accommodation & Food Services E044 Industry -- Civilian Employed Population 16 Years+ -- Other Services Except Public Administration E045 Industry -- Civilian Employed Population 16 Years+ -- Public Administration E047 Class of Worker -- Civilian Employed Population 16 Years+ -- Private Wage & Salary Workers E048 Class of Worker -- Civilian Employed Population 16 Years+ -- Government Workers E049 Class of Worker -- Civilian Employed Population 16 Years+ -- Self-Employed in Own Not Incorporated Business Workers E050 Class of Worker -- Civilian Employed Population 16 Years+ -- Unpaid Family Workers E052 Total Households -- Income and Benefits -- Less Than $10,000 E053 Total Households -- Income and Benefits -- $10,000 to $14,999 E054 Total Households -- Income and Benefits -- $15,000 to $24,999 E055 Total Households -- Income and Benefits -- $25,000 to $34,999 E056 Total Households -- Income and Benefits -- $35,000 to $49,999 E057 Total Households -- Income and Benefits -- $50,000 to $74,999 E058 Total Households -- Income and Benefits -- $75,000 to $99,999 E059 Total Households -- Income and Benefits -- $100,000 to $149,999 E060 Total Households -- Income and Benefits -- $150,000 to $199,999 E061 Total Households -- Income and Benefits -- $200,000 or More E062 Median Household Income E063 Mean Household Income E064 Income and Benefits -- Households -- with Earnings E065 Income and Benefits -- Households -- with Earnings -- Mean Earnings (Dollars) E066 Income and Benefits -- Households -- with Social Security E067 Income and Benefits -- Households -- with Social Security -- Mean Social Security Income (Dollars) E068 Income and Benefits -- Households -- with Retirement Income E069 Income and Benefits -- Households -- with Retirement Income -- Mean Retirement Income (Dollars) E070 Income and Benefits -- Households -- with Supplemental Security Income E071 Income and Benefits -- Households -- with Supplemental Security Income -- Mean Supplemental Security Income (Dollars) E072 Income and Benefits -- Households -- with Cash Public Assistance Income E073 Income and Benefits -- Households -- with Cash Public Assistance Income -- Mean Cash Public Assistance Income (Dollars) E074 Income and Benefits -- Households -- with Food Stamp/Snap Benefits in the Past 12 Months E075 Income and Benefits -- Families E076 Income and Benefits -- Families -- Less Than $10,000 E077 Income and Benefits -- Families -- $10,000 to $14,999 E078 Income and Benefits -- Families -- $15,000 to $24,999 E079 Income and Benefits -- Families -- $25,000 to $34,999 E080 Income and Benefits -- Families -- $35,000 to $49,999 E081 Income and Benefits -- Families -- $50,000 to $74,999 E082 Income and Benefits -- Families -- $75,000 to $99,999 E083 Income and Benefits -- Families -- $100,000 to $149,999 E084 Income and Benefits -- Families -- $150,000 to $199,999 E085 Income and Benefits -- Families -- $200,000 or More E086 Median Family Income E087 Mean Family Income E088 Per Capita Income E089 Nonfamily Households E090 Nonfamily Households -- Median Nonfamily Income E091 Nonfamily Households -- Mean Nonfamily Income E092 Median Earnings for Workers E093 Median Earnings for Male Full-Time Year-Round Workers E094 Median Earnings for Female Full-Time Year-Round Workers E095 Civilian Noninstitutionalized Population E096 Civilian Noninstitutionalized Population -- Health Insurance Coverage -- .... with Health Insurance Coverage E097 Civilian Noninstitutionalized Population -- Health Insurance Coverage -- ...... with Private Health Insurance Coverage E098 Civilian Noninstitutionalized Population -- Health Insurance Coverage -- ...... with Public Health Coverage E099 Civilian Noninstitutionalized Population -- Health Insurance Coverage -- .... No Health Insurance Coverage E119 Percent Families whose income past 12 onths below poverty level E128 Percent All People whose income past 12 onths below poverty level H001 Total Housing Units H002 Occupied Housing Units H003 Vacant Housing Units H004 Homeowner Vacancy Rate H005 Rental Vacancy Rate H007 Total Housing Units -- Units in Structure -- 1-Unit Detached H008 Total Housing Units -- Units in Structure -- 1-Unit Attached H009 Total Housing Units -- Units in Structure -- 2 Units H010 Total Housing Units -- Units in Structure -- 3 or4 Units H011 Total Housing Units -- Units in Structure -- 5 to 9 Units H012 Total Housing Units -- Units in Structure -- 10 to 19 Units H013 Total Housing Units -- Units in Structure -- 20 or More Units H014 Total Housing Units -- Units in Structure -- Mobile Home H015 Total Housing Units -- Units in Structure -- Boat Rv Van Etc. H017 Total Housing Units -- Year Built -- 2020 or later H018 Total Housing Units -- Year Built -- 2010 to 2019 H019 Total Housing Units -- Year Built -- 2000 to 2009 H020 Total Housing Units -- Year Built -- 1990 to 1999 H021 Total Housing Units -- Year Built -- 1980 to 1989 H022 Total Housing Units -- Year Built -- 1970 to 1979 H023 Total Housing Units -- Year Built -- 1960 to 1969 H024 Total Housing Units -- Year Built -- 1950 to 1959 H025 Total Housing Units -- Year Built -- 1940 to 1949 H026 Total Housing Units -- Year Built -- 1939 or earlier H037 Total Housing Units -- Rooms -- Median Rooms H046 Tenure -- Owner-Occupied H047 Tenure -- Renter-Occupied H048 Tenure -- Average Household Size of Owner-Occupied Unit H049 Tenure -- Average Household Size of Renter-Occupied Unit H051 Year Householder Moved into Unit -- 2019 or later H052 Year Householder Moved into Unit -- 2015 to 2018 H053 Year Householder Moved into Unit -- 2010 to 2014 H054 Year Householder Moved into Unit -- 2000 to 2009 H055 Year Householder Moved into Unit -- 1990 to 1999 H056 Year Householder Moved into Unit -- 1989 or earlier H058 Occupied housing units -- No Vehicles Available H059 Occupied housing units -- Vehicles Available -- 1 Vehicle Available H060 Occupied housing units -- Vehicles Available -- 2 Vehicles Available H061 Occupied housing units -- Vehicles Available -- 3 or More Vehicles Available H063 House Heating Fuel -- Utility Gas H064 House Heating Fuel -- Bottled Tank or LP Gas H065 House Heating Fuel -- Electricity H066 House Heating Fuel -- Fuel Oil Kerosene Etc. H067 House Heating Fuel -- Coal orCoke H068 House Heating Fuel -- Wood H069 House Heating Fuel -- Solar Energy H077 Occupants per Room -- 1.00 or Less H078 Occupants per Room -- 1.01 to 1.50 H079 Occupants per Room -- 1.51 or More H081 Value -- Less Than $50 000 H082 Value -- $50 000 to $99 999 H083 Value -- $100 000 to $149 999 H084 Value -- $150 000 to $199 999 H085 Value -- $200 000 to $299 999 H086 Value -- $300 000 to $499 999 H087 Value -- $500 000 to $999 999 H088 Value -- $1 000 000 or More H089 Median Housing Value H090 Owner-Occupied Units H091 Mortgage Status -- Housing Units with a Mortgage H092 Mortgage Status -- Housing Units Without a Mortgage H126 Occupied Units Paying Rent H127 Gross Rent -- Less Than $500 H128 Gross Rent -- $500 to $999 H129 Gross Rent -- $1,000 to $1,499 H130 Gross Rent -- $1,500 to $1,999 H131 Gross Rent -- $2,000 to $2,499 H132 Gross Rent -- $2,500 to $2,999 H133 Gross Rent -- $3,000 or More H134 Median Rent Data used in this section are based on annual city population estimates developed by the Census Bureau using model-based methods. A city as used here relates to incorporated cities and do not include census designated places or minor civil divisions (included in subscriber database). These data are updated/extended annually creating a time series. The estimates are current annual estimates as of July 1 in the data year referenced. Extended Data For Cities .. goto top Data used in this section are the total scope of subject matter for cities from this statistical program. Richer demographics are available for cities from the American Community Survey (ACS 2022) .. a companion but different statistical program and mmethodology. Subscribers receive access to these data as updated annually. Illustrative America's Demographic Profiles for Selected Cities .. ACS 2022 1 year estimates Frisco, TX Denton, TX Lansing, MI Detroit, MI Terms of Use .. goto top There is no warranty about any aspect of the data or information presented in this section or related sections. The user of these data and information is solely responsible for any use. Support Using these Resources .. goto top Learn more about demographic economic data and related analytical tools. Join us in a Data Analytics Lab session. There is no fee for these Web sessions. Each informal session is focused on a specific topic. The open structure also provides for Q&A and discussion of application issues of interest to participants. ProximityOne User Group .. goto top Join the ProximityOne User Group to keep up-to-date with new developments relating to geographic-demographic-economic decision-making information resources. Receive updates and access to tools and resources available only to members. Use this form to join the User Group. Additional Information .. goto top ProximityOne develops geodemographic-economic data and analytical tools and helps organizations knit together and use diverse data in a decision-making and analytical framework. We develop custom demographic/economic estimates and projections, develop geographic and geocoded address files, and assist with impact and geospatial analyses. Wide-ranging organizations use our tools (software, data, methodologies) to analyze their own data integrated with other data. Follow ProximityOne on Twitter at www.twitter.com/proximityone. Contact us (888-364-7656) with questions about data covered in this section or to discuss custom estimates, projections or analyses for your areas of interest. |
|
|