|
CV & Jackson MSA |
  
|
| Show/Hide Hidden Text |
|
CV & Jackson MSA |
|
| Show/Hide Hidden Text |
Complexities of large metropolitan areas may be viewed/analyzed in different ways to meet different needs using the CommunityViewer GIS. This section shows a series of views focused on the Jackson, MS MSA illustrating use of CV and the main project datasets.
Congressional districts (red boundary) in context of 5-county MSA. Interstate and street detail.
|
Congressional districts (red boundary) in context of 5-county MSA. K-12 schools (see markers in legend) and school districts (blue boundary)
|
Zoom-in view of central interstate loop. Schools with name labels shown in context streets.
|
Further zoom-in view of central interstate loop. Schools with name labels shown in context streets. Percent high school graduates shows pattern of educational attainment by census tract.
|
Examining Patterns of Economic Prosperity
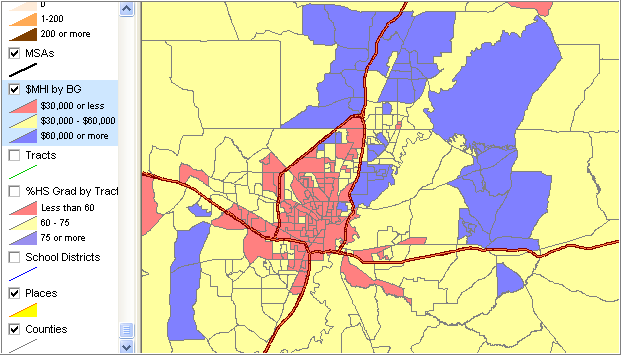
Census 2000 Median Household Income by Block Group (2,143 BGs in MS)
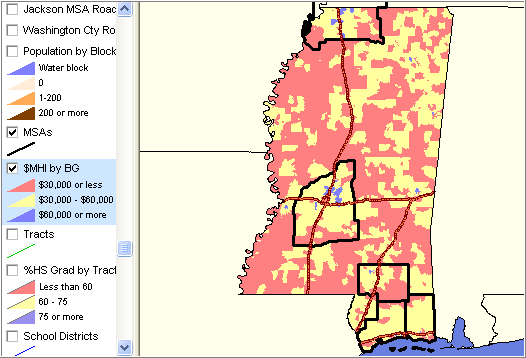
Zoom-in to Jackson MSA
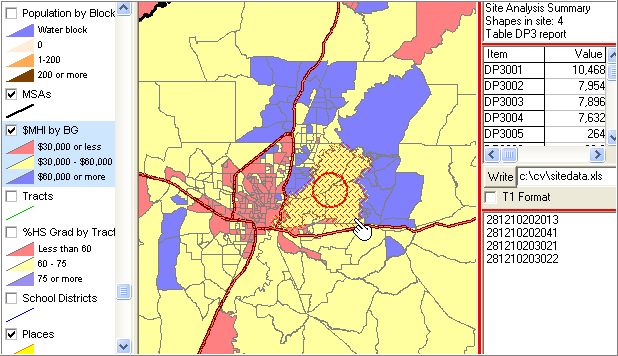
Analysis Using Broader Set of Demographics (600+ items)
Using Site Analysis, selecting 4 block groups
Upper right panel displays aggregate for all DP3 items (DP3004 is total employment)
Lower right panel displays block group geocodes
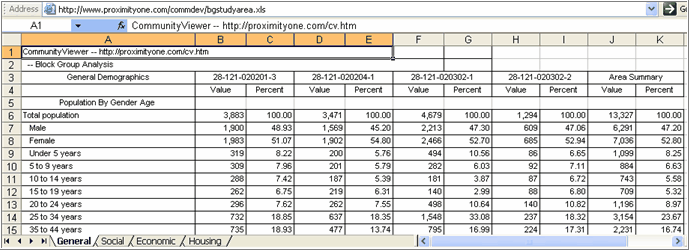
Demographic Profiles for 4 BG Study Area (displayed as 4 panel grid)
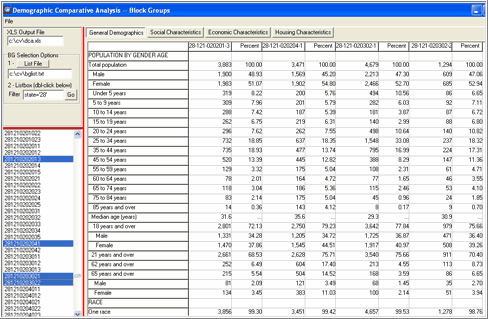
Demographic Profiles for 4 BG Study Area (saved as 4 worksheet XLS file)
Four worksheets provide organized display of DP1 ... DP2 ... DP3 ... DP4
View 4 worksheet XLS file at http://www.proximityone.com/commdev/bgstudyarea.xls
Note that rightmost columns provide summary of BG attributes for study area.
Page url: http://proximityone.com/commdev/guide/index.html?metros_jackson.htm


