Population Pyramids

Contents
Use the Population Pyramids to generate age-race/gender Web pages with integrated tables and charts. Start this feature t from the Main Menu ChartGraphics>PopulationPyramids.
|
The ChartGraphics component provides access to charts and visual representations of subject matter data.
The age and gender structure of a population is one of its most important and formative features, because nearly all demographic characteristics and processes vary by age and gender. Age and gender composition is also revealing in that it reflects those demographic characteristics and processes. Population pyramid chart graphics can help us visualize and more easily understand age-gender structure -- and how it is changing over time. Use software and data resources that we have developed, and illustrated here, to analyze populations for geographic areas of interest to you. Details are described below. Visualizing Population Distribution by Gender and Age The graphics below illustrate how population pyramids, and related tables, can be used to explore characteristics of the Asian Indian population by gender and age. One graphic shows Census 2000 data, the second graphic shows Census 2010 data. Census 2000 U.S. Asian Indian alone population ... 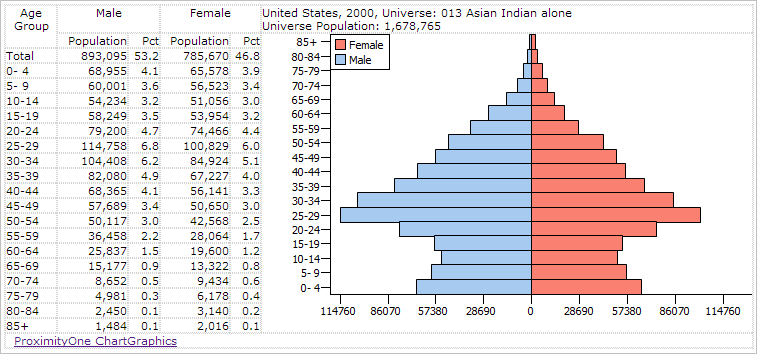 Click graphic to view as HTML. Census 2010 U.S. Asian Indian alone population ... 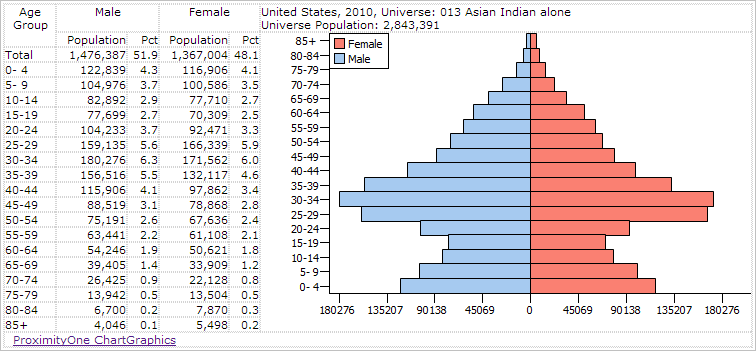 Click graphic to view as HTML. Gaining Insights The population pyramid helps us understand the age and gender structure of a population in a specific area, like a county or state. The shape of the pyramid can show the potential for future growth and provide hints about past trends. A top-heavy pyramid suggests negative population growth that might be due to many factors, including high death rates, low birthrates and increased emigration. A bottom-heavy pyramid suggests high birthrates, falling or stable death rates and potential for rapid population growth. The population pyramid shows a male population bar chart (left side of pyramid, blue) symmetrically with a female population bar chart (right side of pyramid, light red). Each bar shows the population by 5-year age group, 0-4 years to 80-84 years and 85 years and over. Selected Population Pyramids (total population for year 2010 unless noted) • Beverly Hills USD, CA • Los Angeles USD, CA • Austin ISD, TX • Bronte ISD, TX • College Station ISD, TX • Conroe ISD, TX • Cypress-Fairbanks ISD, TX • Houston ISD, TX • Laredo ISD, TX • San Marcos CISD, TX • Cook County, IL (Chicago) -- 2000 .. 2010 • Los Angeles County, CA -- 2000 .. 2010 • New York County, NY (Manhattan) -- 2000 .. 2010 • Strafford County, NH -- 2000 .. 2010 Population Pyramids for U.S. and States - scroll section
Population Pyramids with Narrative -- Patterns of Change: 2010-2050 • Future of China • Future of India • Future of Indonesia • World by Country Using Census 2010 Data to Develop Population Pyramids We can use the Census 2010 Summary File 2 Demographic Profile 1 (http://www.proximityone.com/cen2010_sf2.htm) interactive ranking table to determine that Santa Clara County, CA has the largest Asian Indian alone population based on Census 2010. The geographic summary level is set to county, the Race Group is set to Asian Indian alone, and the header column D001 (total population) is clicked to determine that Santa Clara County has an Asian Indian alone population of 117,596. In these examples, the bar maximum population value has been set to 10,000 (can be set to any value) making it easier to compare the distributions between 2000 and 2010. 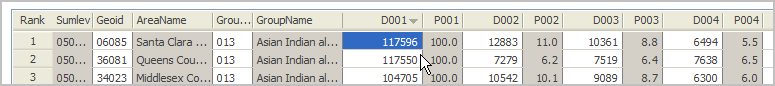 Census 2000 Santa Clara County, CA Asian Indian alone population ... 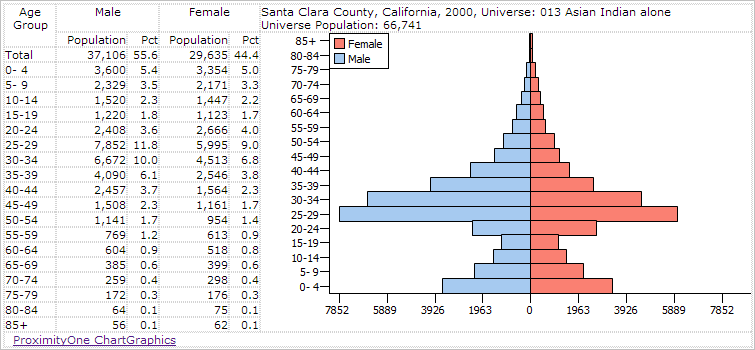 Click graphic to view as HTML. Census 2010 Santa Clara County, CA Asian Indian alone population ... 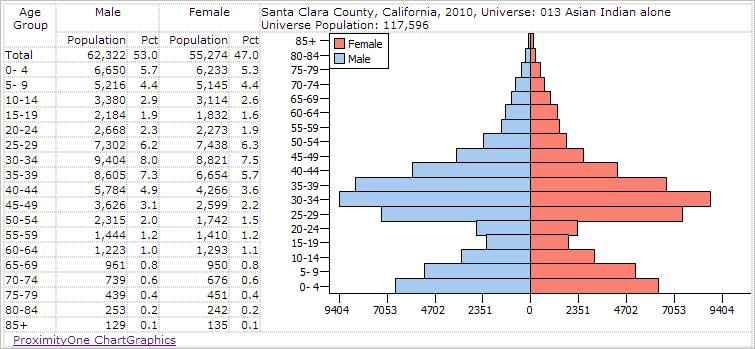 Click graphic to view as HTML. Start Exploring Now! Use ChartGraphics software with ready-to-use U.S. national scope U.S., state and county data to create your own population pyramids like those reviewed here. The following view shows the ChartGraphics user interface when used to display the data for Santa Clara County. An optional setting enables the user to publish the population pyramid and associated age-gender population by age table as shown in the above graphics. The resulting published data is in HTML structure and ready to integrate into your documents. As shown in this view, you can easily select the year, race group and geographic area of interest. 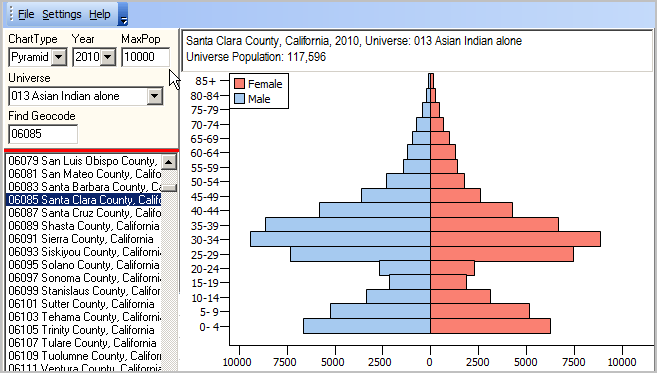
|