|
|
|
ChartGraphics Population Pyramids & Age-Cohort Analysis -- World by Country, 2000 through 2050
The population of China is projected to change from 1.33 billion in 2010 to 1.30 billion in 2050. How will China age-cohort patterns in 2010 compare to those projected for 2050? How do these patterns compare with those of the United States? Use the ChartGraphics tools to get answers to these types of questions and gain insights world by country age-cohort patterns over time ... into the future. Population pyramids developed using ChartGraphics provide an easy-to-develop and consume visual analysis of these patterns. This section illustrates use of ChartGraphics to develop population pyramids for the selected countries as of 2010 and 2050. Population pyramids may be developed for any country listed in the interactive table presented in this section. China, Total Population, 2010 Click graphic to view as HTML. 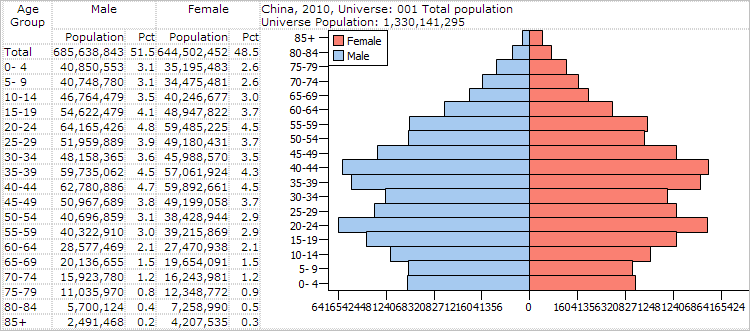 China, Total Population, 2050 Click graphic to view as HTML. 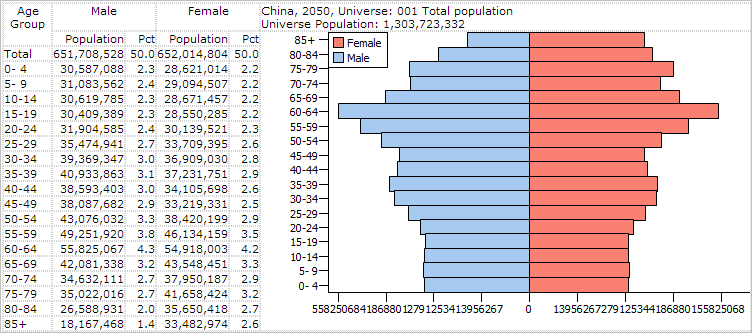 United States, Total Population, 2010 Click graphic to view as HTML. 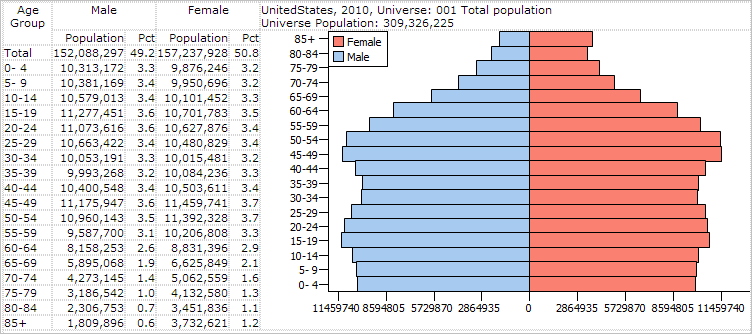 United States, Total Population, 2050 Click graphic to view as HTML. 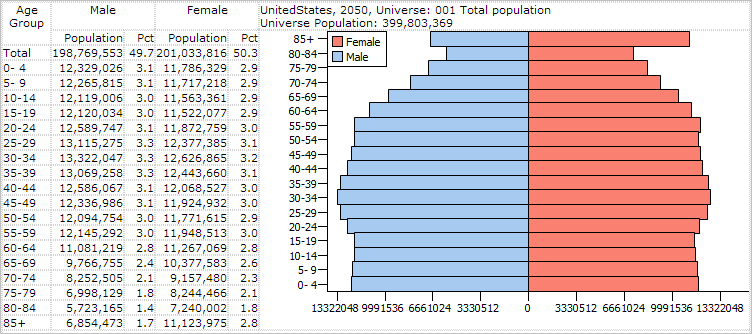 World by Country, 2010 Population -- interactive table Countries in this table are available in the ChartGraphics World by Country Dataset. See ranking table usage notes below ranking table. See related ranking tables -- http://proximityone.com/rankingtables.htm. The ChartGraphics World by Population dataset includes countries for which the Census Bureau develops demographic estimates and projections. The dataset includes those estimates and projections supplemented with other data. Additional Information ProximityOne develops geographic-demographic-economic data and analytical tools and helps organizations knit together and use diverse data in a decision-making and analytical framework. We develop custom demographic/economic estimates and projections, develop geographic and geocoded address files, and assist with impact and geospatial analyses. Wide-ranging organizations use our tools (software, data, methodologies) to analyze their own data integrated with other data. Follow ProximityOne on Twitter at www.twitter.com/proximityone. Contact us (888-364-7656) with questions about data covered in this section or to discuss custom estimates, projections or analyses for your areas of interest. |
|
|