
|
|
|
The population of India is projected to change from 1.17 billion in 2010 to 1.66 billion in 2050, an increase of 483.5 million or 41.2%. How will India age-cohort patterns in 2010 compare to those projected for 2050? How do these patterns compare with those of the United States; other countries? This section illustrates use of population pyramids to examine age by gender demographic patterns for India as of 2010 and 2050. Similar population pyramids can be developed for any country. Population pyramids help us visualize and more easily understand age-gender structure -- and how it is changing over time. India in Context of Region 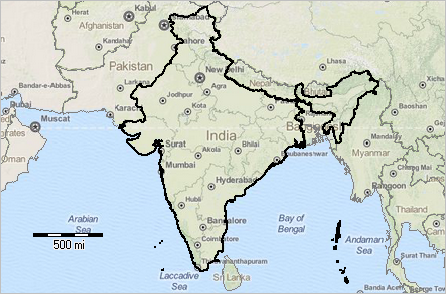 View developed with CV XE GIS; see more about this GIS project below. Population Pyramids Population pyramids are bar-chart graphical depictions of the population size by gender by age group. They help us understand the implications of male-female population size by age and what that might suggest for the future. A top-heavy pyramid suggests negative population growth that might be due to many factors, including high death rates, low birthrates and increased emigration. A bottom-heavy pyramid suggests high birthrates, falling or stable death rates and potential for rapid population growth. The population pyramid shows a male population bar chart (left side of pyramid, blue) symmetrically with a female population bar chart (right side of pyramid, light red). Each bar shows the population by 5-year age group, 0-4 years to 80-84 years and 85 years and over. India, Total Population, 2010 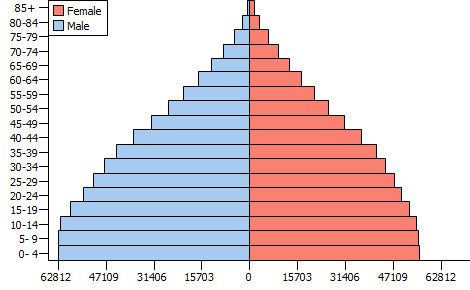 X-axis shows population in thousands. Click graphic for larger view. India, Total Population, 2050 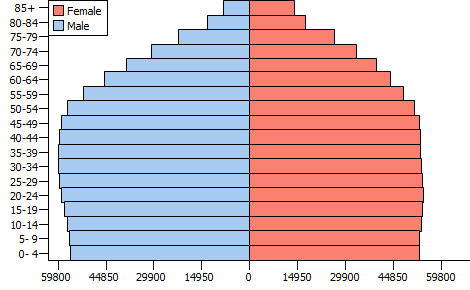 X-axis shows population in thousands. Click graphic for larger view. More About India Demographics; Examining Other Countries Use the ChartGraphics tools to get answers to these types of questions and gain insights world by country age-cohort patterns over time ... into the future. Population pyramids developed using ChartGraphics provide an easy-to-develop and consume visual analysis of these patterns. ChartGraphics is available at no fee to ProximityOne User Group members. Join now, there is no fee. Support & DMI Web Sessions Using age-cohort analysis tools ... learn more about using age-cohort patterns and analysis. Join us in a Decision-Making Information Web session. There is no fee for these one-hour Web sessions. Each informal session is focused on a specific topic. The open structure also provides for Q&A and discussion of application issues of interest to participants. We can address your specific questions about using metro and county demographic economic data and related applications. Additional Information ProximityOne develops geographic-demographic-economic data and analytical tools and helps organizations knit together and use diverse data in a decision-making and analytical framework. We develop custom demographic/economic estimates and projections, develop geographic and geocoded address files, and assist with impact and geospatial analyses. Wide-ranging organizations use our tools (software, data, methodologies) to analyze their own data integrated with other data. Follow ProximityOne on Twitter at www.twitter.com/proximityone. Contact ProximityOne (888-364-7656) with questions about data covered in this section or to discuss custom estimates, projections or analyses for your areas of interest. |
|
|