Selected CommunityViewer project/application views in Michigan.
Click toggle in Table of Contents at left to view sub-state applications.
Integrating Census 2010 TIGER Shapefiles, ACS 2009 5-year demographics and related data.
See related interactive ranking tables:
(all US geography: state, congressional district, county, school district, city/place, metro)
The table presented below provides a summary demographic profile for the village based on the Census 2010 P.L. 94-171 data. Similar to a profile developed by Census, this profile also includes two columns providing characteristics for the population under 18 years of age. These profiles are available for any Census 2010 geography, census block and higher level geography.
Census 2010 PL94171 Demographic Profile -- Romeo village, MI
Census 2010 P.L. 94-171 Profile -- Romeo village, MI (MI0457928)
ProximityOne -- additional details and interactive ranking table
| Subject | Total | 18 years and over | Under 18 years | | Number | Percent | Number | Percent | Number | Percent |
| POPULATION |
| Total Population | 3,596 | 100.0 | 2,750 | 100.0 | 846 | 100.0 |
| RACE |
| One Race | 3,504 | 97.4 | 2,712 | 98.6 | 792 | 93.6 |
| White | 3,303 | 91.9 | 2,559 | 93.1 | 744 | 87.9 |
| Black or African American | 137 | 3.8 | 110 | 4.0 | 27 | 3.2 |
| American Indian and Alaska Native | 6 | 0.2 | 5 | 0.2 | 1 | 0.1 |
| Asian | 18 | 0.5 | 15 | 0.5 | 3 | 0.4 |
| Native Hawaiian and Other Pacific Islander | 0 | 0.0 | 0 | 0.0 | 0 | 0.0 |
| Some Other Race | 40 | 1.1 | 23 | 0.8 | 17 | 2.0 |
| Two or More Races | 92 | 2.6 | 38 | 1.4 | 54 | 6.4 |
HISPANIC OR LATINO AND RACE |
| Hispanic or Latino (of any race) | 206 | 5.7 | 119 | 4.3 | 87 | 10.3 |
| Not Hispanic or Latino | 3,390 | 94.3 | 2,631 | 95.7 | 759 | 89.7 |
| One Race | 3,310 | 92.0 | 2,597 | 94.4 | 713 | 84.3 |
| White | 3,149 | 87.6 | 2,468 | 89.7 | 681 | 80.5 |
| Black or African American | 134 | 3.7 | 110 | 4.0 | 24 | 2.8 |
| American Indian and Alaska Native | 6 | 0.2 | 5 | 0.2 | 1 | 0.1 |
| Asian | 16 | 0.4 | 13 | 0.5 | 3 | 0.4 |
| Native Hawaiian and Other Pacific Islander | 0 | 0.0 | 0 | 0.0 | 0 | 0.0 |
| Some Other Race | 5 | 0.1 | 1 | 0.0 | 4 | 0.5 |
| Two or More Races | 80 | 2.2 | 34 | 1.2 | 46 | 5.4 |
HOUSING UNITS |
| Total housing units | 1,659 | 100.0 | | | | |
OCCUPANCY STATUS |
| Occupied housing units | 1,501 | 90.5 | | | | |
| Vacant housing units | 158 | 9.5 | | | | |
Data source: Census 2010, P.L. 94-171 data files.
|
The table presented below provides a summary demographic profile for the school district based on the Census 2010 P.L. 94-171 data. Similar to a profile developed by Census, this profile also includes two columns providing characteristics for the population under 18 years of age. These profiles are available for any Census 2010 geography, census block and higher level geography.
Census 2010 PL94171 Demographic Profile -- Romeo Community Schools, MI
Census 2010 P.L. 94-171 Profile -- Romeo Community Schools, MI (MI0459243)
ProximityOne -- additional details and interactive ranking table
| Subject | Total | 18 years and over | Under 18 years | | Number | Percent | Number | Percent | Number | Percent |
| POPULATION |
| Total Population | 34,011 | 100.0 | 25,672 | 100.0 | 8,339 | 100.0 |
| RACE |
| One Race | 33,534 | 98.6 | 25,475 | 99.2 | 8,059 | 96.6 |
| White | 32,198 | 94.7 | 24,572 | 95.7 | 7,626 | 91.4 |
| Black or African American | 518 | 1.5 | 360 | 1.4 | 158 | 1.9 |
| American Indian and Alaska Native | 82 | 0.2 | 69 | 0.3 | 13 | 0.2 |
| Asian | 348 | 1.0 | 244 | 1.0 | 104 | 1.2 |
| Native Hawaiian and Other Pacific Islander | 10 | 0.0 | 6 | 0.0 | 4 | 0.0 |
| Some Other Race | 378 | 1.1 | 224 | 0.9 | 154 | 1.8 |
| Two or More Races | 477 | 1.4 | 197 | 0.8 | 280 | 3.4 |
HISPANIC OR LATINO AND RACE |
| Hispanic or Latino (of any race) | 1,480 | 4.4 | 880 | 3.4 | 600 | 7.2 |
| Not Hispanic or Latino | 32,531 | 95.6 | 24,792 | 96.6 | 7,739 | 92.8 |
| One Race | 32,111 | 94.4 | 24,622 | 95.9 | 7,489 | 89.8 |
| White | 31,195 | 91.7 | 23,976 | 93.4 | 7,219 | 86.6 |
| Black or African American | 497 | 1.5 | 350 | 1.4 | 147 | 1.8 |
| American Indian and Alaska Native | 63 | 0.2 | 52 | 0.2 | 11 | 0.1 |
| Asian | 339 | 1.0 | 235 | 0.9 | 104 | 1.2 |
| Native Hawaiian and Other Pacific Islander | 10 | 0.0 | 6 | 0.0 | 4 | 0.0 |
| Some Other Race | 7 | 0.0 | 3 | 0.0 | 4 | 0.0 |
| Two or More Races | 420 | 1.2 | 170 | 0.7 | 250 | 3.0 |
HOUSING UNITS |
| Total housing units | 13,421 | 100.0 | | | | |
OCCUPANCY STATUS |
| Occupied housing units | 12,545 | 93.5 | | | | |
| Vacant housing units | 876 | 6.5 | | | | |
Data source: Census 2010, P.L. 94-171 data files.
|
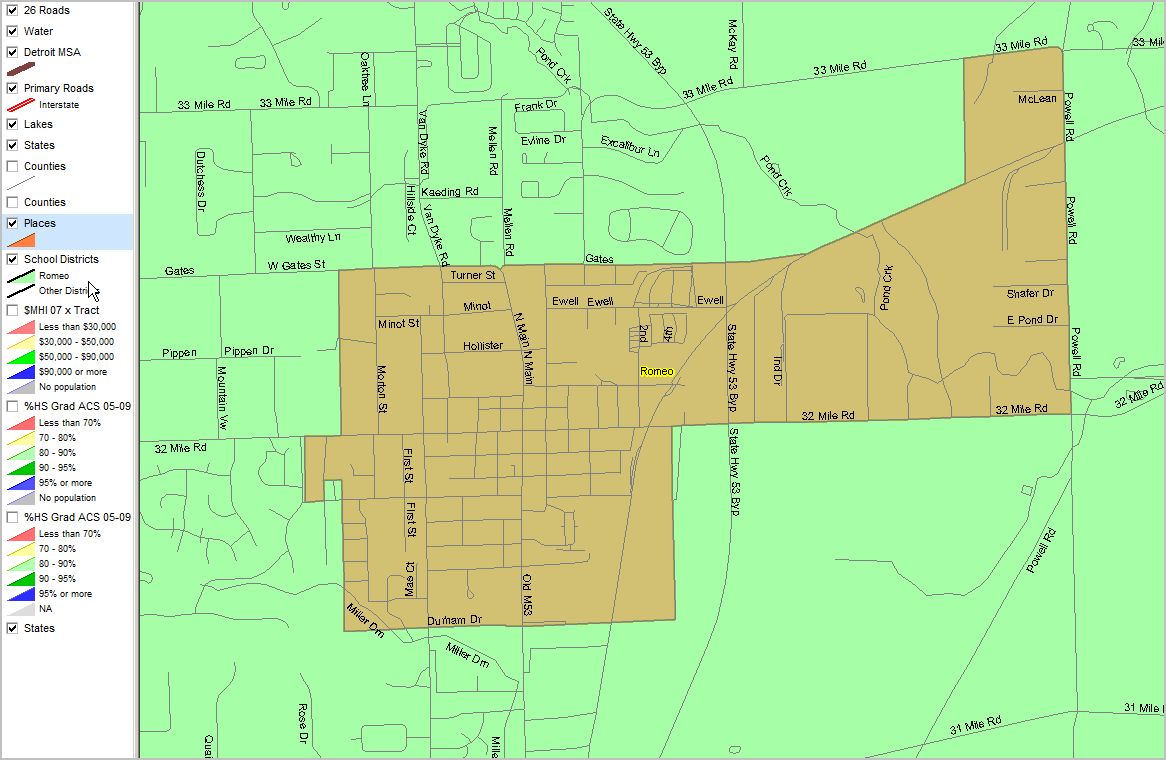
The GIS project fileset used to develop the views shown below is available for your use. Add your own data; create alternative views. We can also provide custom map views or analyses to meet your needs. Contact us for details (888-364-7656).
Focus on Romeo School District, MI
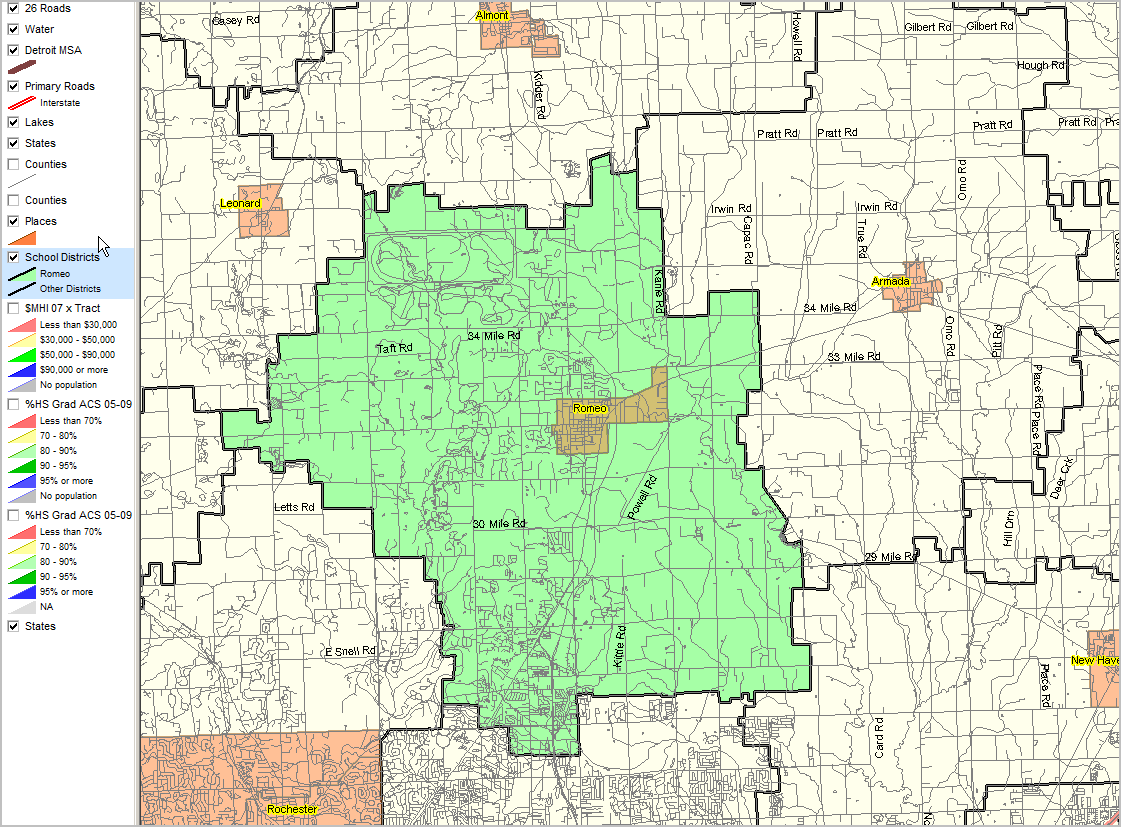
Zoom-in view, Romeo place