U.S. School District Demographic Patterns

Contents
Views in this section show school district demographic patterns based on 2009-10 school year boundaries with integrated Census 2000 and 2010 data.
Related sections:
| • | School district demographics main section -- http://proximityone.com/sddmi.htm |
| • | School district population 2000, 2010 & change -- interactive ranking table -- http://proximityone.com/sd0010.htm |
| • | Census 2010 selected demographics for school districts -- interactive ranking table -- http://proximityone.com/cen2010_pl94171.htm |
| • | 'Richer demographic' updates for school districts -- interactive ranking tables by state -- http://proximityone.com/acs.htm#updates |
| • | Patterns of educational attainment by state and selected regions -- this document -- click a state in left panel |
The GIS project fileset used to develop the views shown below is available for your use. Add your own data; create alternative views. We also provide custom map views or analyses to meet your needs. Contact us for details (888-364-7656).
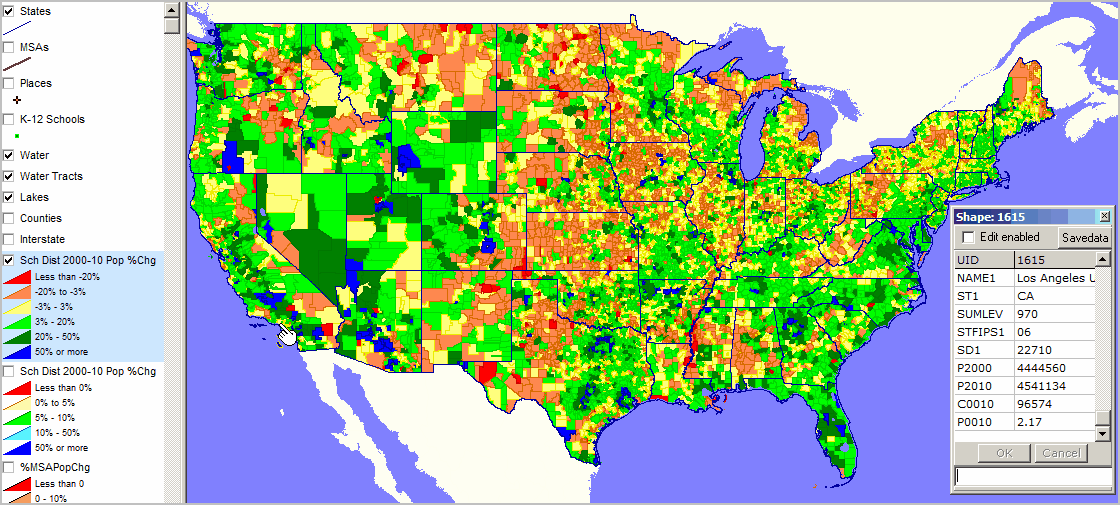
Census 2000 - Census 2010 Population Percent Change
... based on 2009-10 school district boundaries.
See blue highlighted layer in legend panel left of map showing interval values and colors.
CV identify tool used to show mini-profile for Los Angeles USD, CA (see pointer) ... P0010 shows percent population change 2000-2010 -- 2.17 percent.
See zoom-in views below.
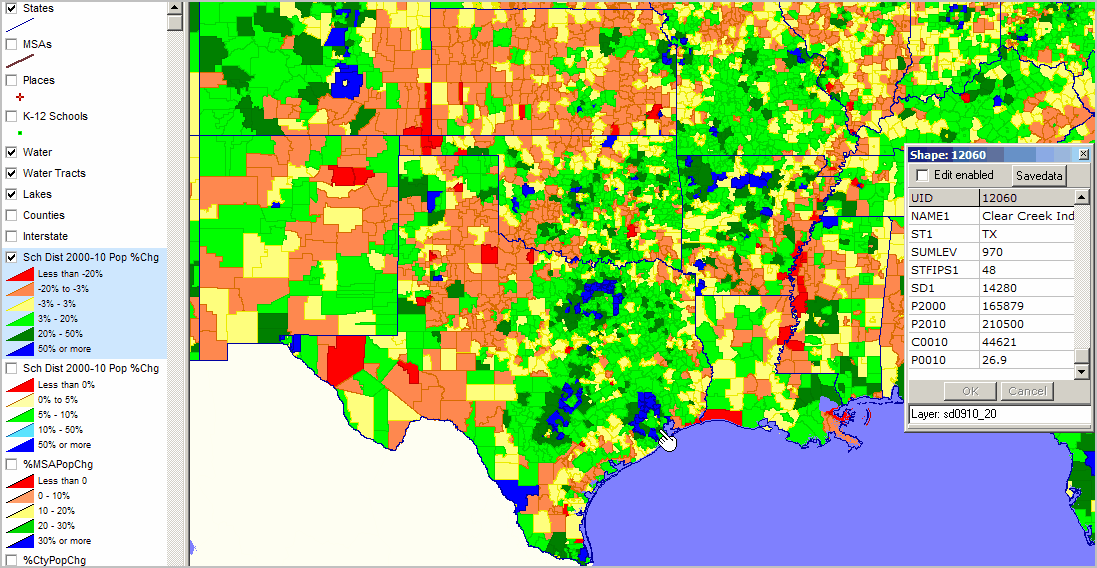
Census 2000 - Census 2010 Population Percent Change ... south central zoom-in view
... based on 2009-10 school district boundaries.
See blue highlighted layer in legend panel left of map showing interval values and colors.
CV identify tool used to show mini-profile for Clear Creek ISD, TX (see pointer near Houston) ... P0010 shows percent population change 2000-2010 -- 26.9 percent.
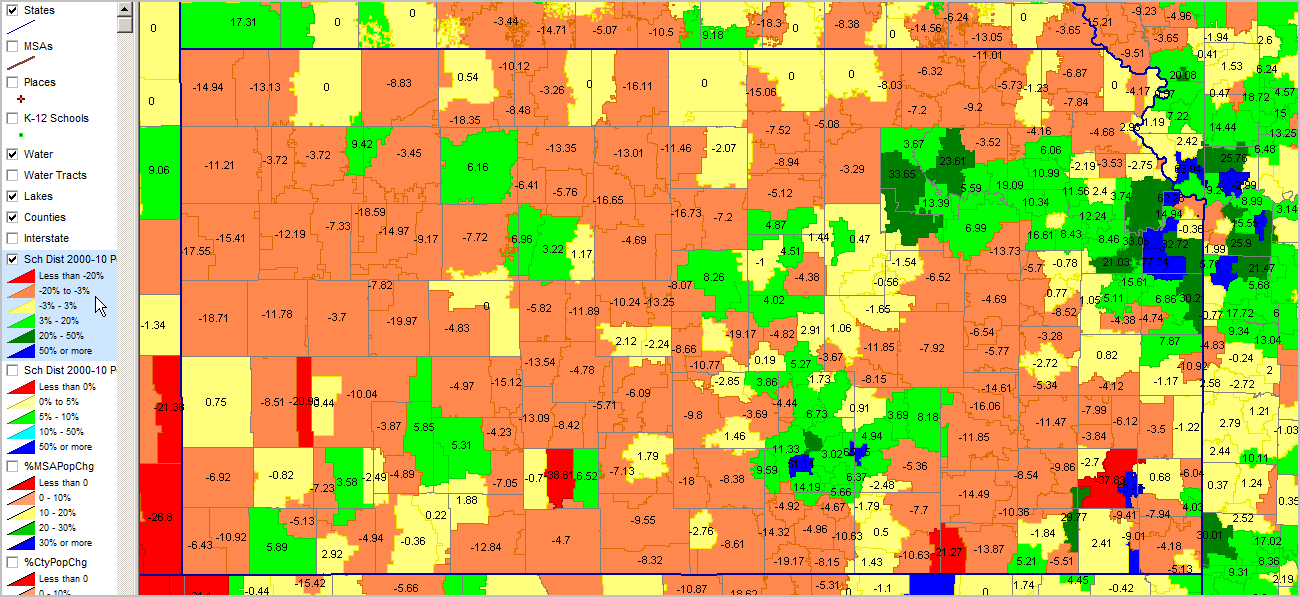
Census 2000 - Census 2010 Population Percent Change ... Kansas zoom-in view
... based on 2009-10 school district boundaries.
See blue highlighted layer in legend panel left of map showing interval values and colors.
County boundary layer visible. School district labels show percent population change 2000-2010.
A few Kansas school districts (northern state border) had boundary changes between 2000 & 2010; these districts have "0" change label.