Williamsburg

Contents
Selected CommunityViewer project/application views in Virginia.
Click toggle in Table of Contents at left to view state/sub-state applications.
Integrating Census 2010 TIGER Shapefiles, ACS 2009 5-year demographics, Census 2010 and related data.
See related interactive ranking tables:
| • | Virginia school district demographics: http://proximityone.com/sd_va.htm. |
| • | Virginia census tract demographics: http://proximityone.com/ustr0509_va.htm. |
| • | Census 2010 demographics: http://proximityone.com/cen2010_pl94171.htm |
(all US geography: state, congressional district, county, school district, city/place, metro)
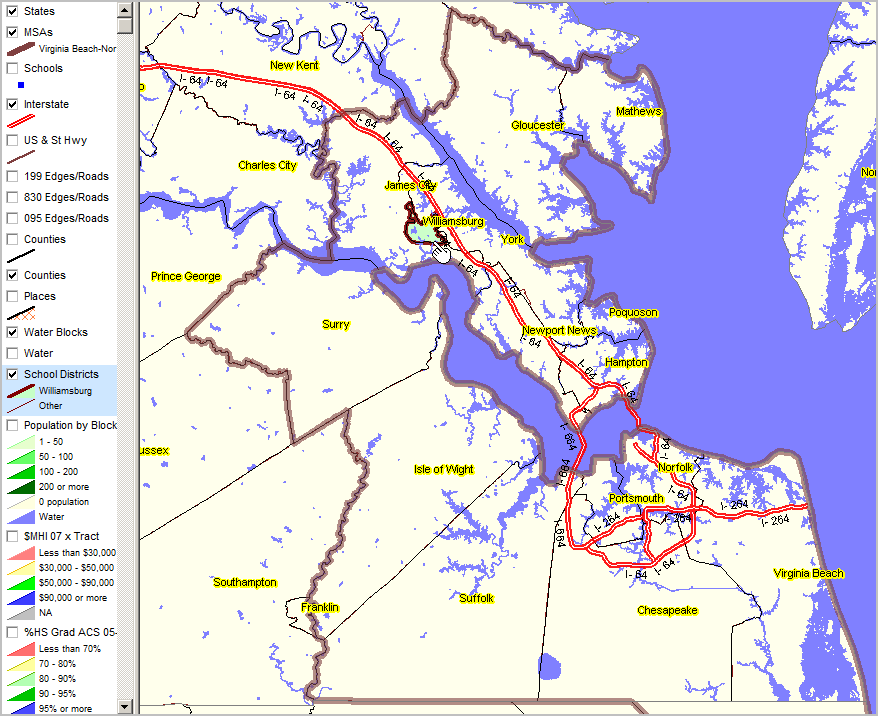
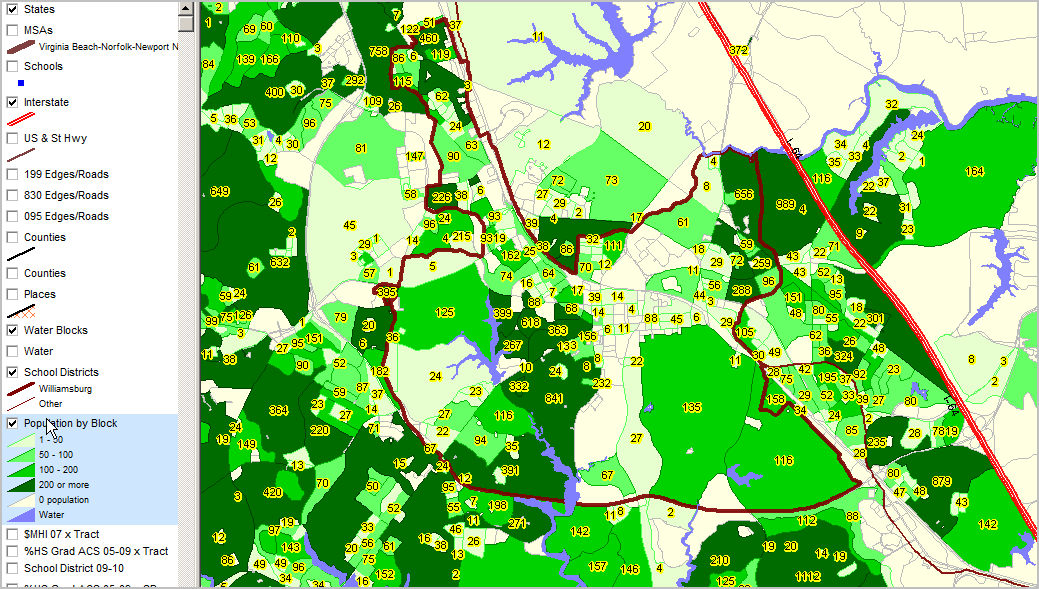
Williamsburg in context of Virginia Beach-Norfolk-Newport News MSA (bold brown semi-transparent boundary) Williamsburg brown boundary green fill pattern.
|
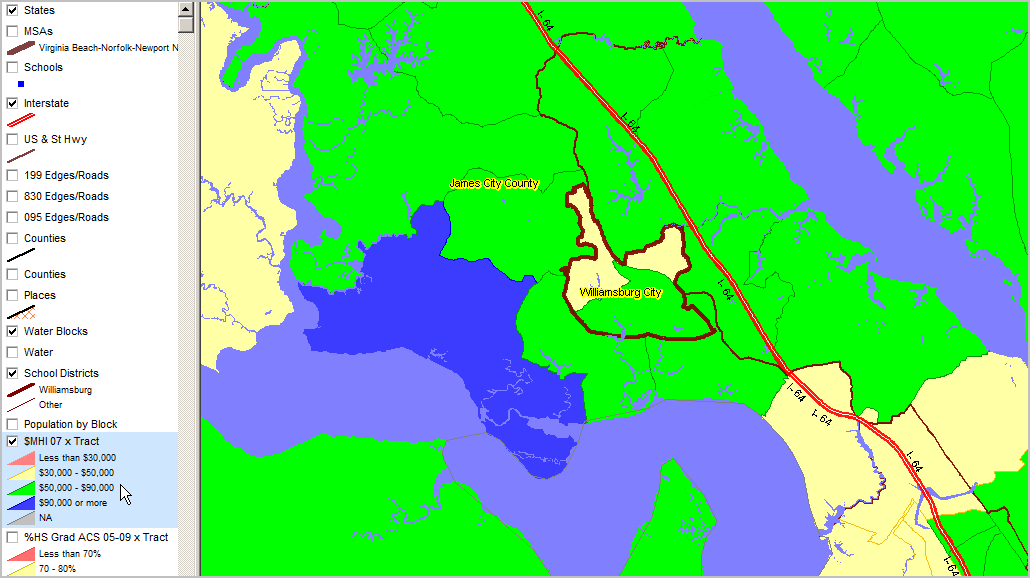
Median Household Income ACS 2005-09 (mid-2007) ... using ACS census tract estimates released December 2010 (http://proximityone.com/acs.htm).
|
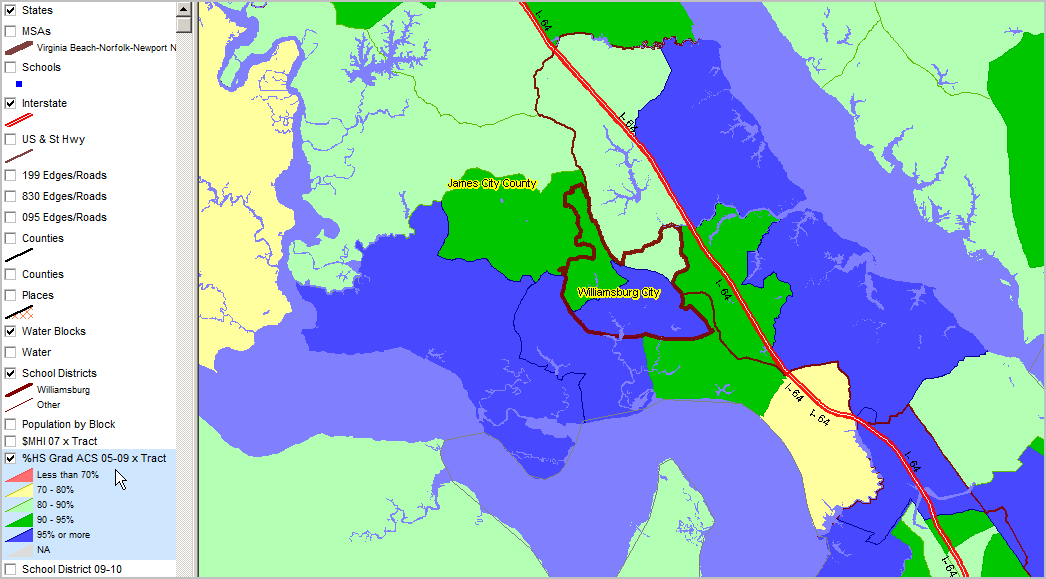
Educational Attainment by Census Tract Percent high school graduate (population 25 years and over) by school district. Data based on 2009 American Community Survey (http://proximityone.com/acs.htm) 5-year estimates, centric to mid-2007.
|
Zoom-in to Williamsburg area. Census blocks show total population label. See highlighted (blue) layer in legend (left of map) for color/data value interval definitions. More about these data: http://proximityone.com/cen2010_blocks.htm.
|
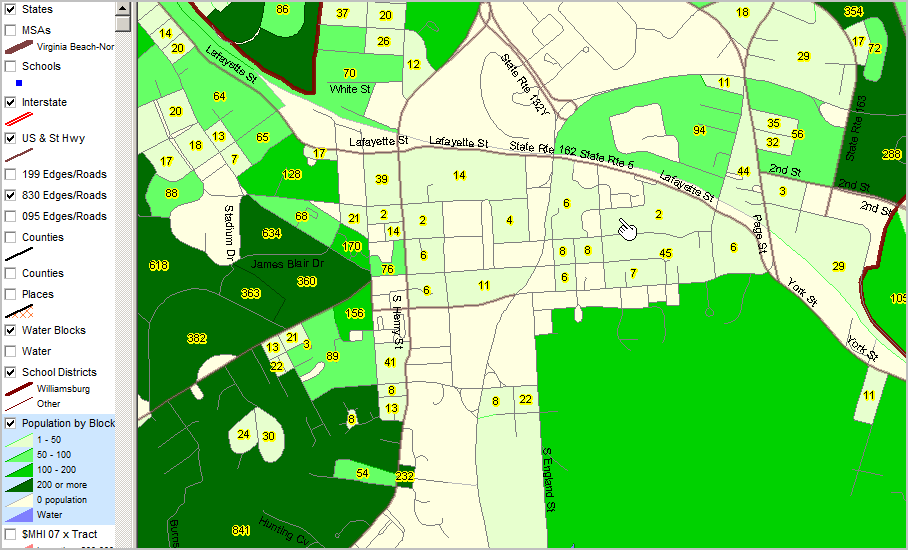
Zoom-in view showing total population by block as label. Intersection-to-intersection street detail.
|
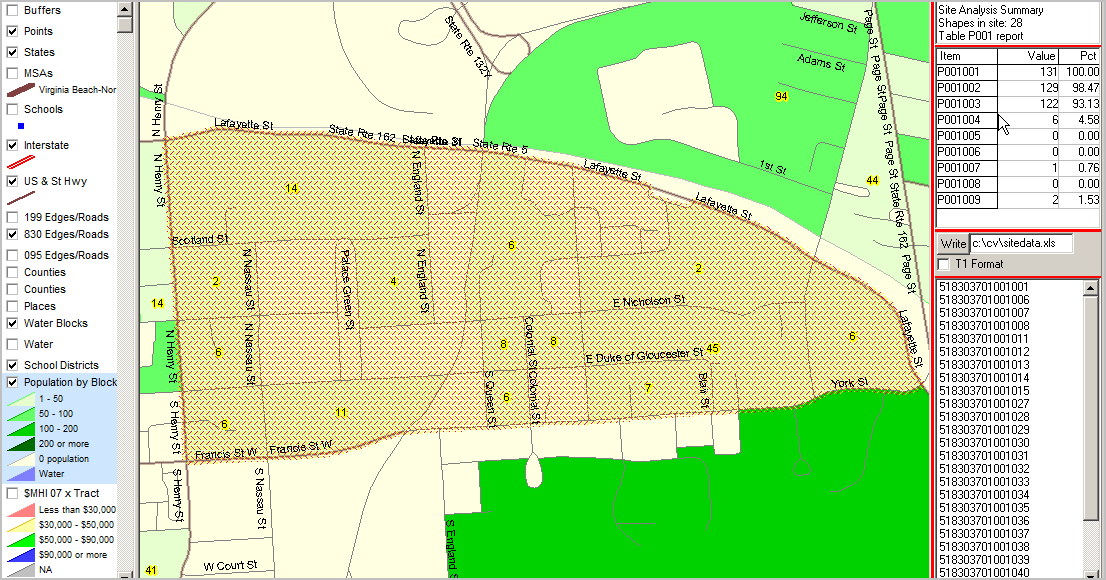
Further zoom-in to Colonial Williamsburg area. CV Site Analysis operation applied to census block layer; manually (by design) selected blocks (cross-hatch pattern). In the graphic below, table in upper right shows 28 blocks in this study area.
Aggregate demographics are shown in the mini table below that count: 131 total population in this set of blocks (p001001); 122 "White population of one race" (p001003) in this set of blocks. (Item names shown in left column of profile defined at http://proximityone.com/cen2010_blocks.htm.)
List of geocodes for blocks included shown in lower right mini table. By clicking "Write" button, the summary data are written to specified spreadsheet file.
|