
|
|
|
Topics/Resources ... 
• Houston Area School Districts ... view as overlay on interactive maps ... click marker/links to access data ... data links for each district shown in graphic --> • Houston Metro and Regional Decision Making Information Projects ... ready-to-use integrated, multi-sourced demographic/economic data Sample views (press F11 after display for best view): - Houston MSA: School Districts & Schools/Charter Schools - Houston Zoom-in: School Districts & Schools by Title I Status - Houston Zoom-in: School Age Population by Census Block • Texas School and School District Enrollment Trends ... statewide school and school district time series and rankings • Texas by School District TAKS 2003 Thematic Maps ... Texas Assessment of Knowledge and Skills (TAKS) pattern analyses ... view relationships among regions and districts • Linking TAKS Assessment Data with Socioeconomic Indicators & Rankings ... rank Texas school districts based on socioeconomic measures ... assess your own peer groups ... see examples for Houston area school districts • Children in Poverty & Federal Revenues by Texas School District ... see how number of children in poverty correspond to Title I and Child Nutrition Act revenues by district. • Houston-Baytown-Sugar Land, TX MSA Average Annual Wages ... ranks 15th among all 2003 MSAs (362 areas excluding Puerto Rico) ... Average Annual Wages were $41,996 in 2002. ... See national ranking. • Harris County Demographic Trends ... post Census 2000 Census Bureau demographic estimates. ... see Hispanic population by 5-year age cohort data and trends. • Dallas and Houston School Districts in Largest 25 U.S. School Districts Ranking ... includes growth trends over 5-year period centered on Census 2000. • Houston School District: 36,000 relevant children not enrolled ... including 25,000 who are Latino ... see related poverty incidence characteristics. • Harris County: Migration Inflows and Outflows, 1995-2000 ... county by county origin and destination of movers. • Harris County by City: See Latest City Population Estimates ... map of Houston metro showing city population change. • Houston Metropolitan Area Changes under OMB Revisions ... see details and implications of change. • Harris County, TX Census 2000 Public Use Microdata Sample geography ... more about Census 2000 PUMS Files. • View Houston-Galveston-Brazoria, TX CMSA (pre-2003) component counties. • View Houston-Galveston-Brazoria, TX CMSA with City of Houston. (depicts point used in site analysis) • Proximity Houston-Galveston-Brazoria Area Census 2000 GeoDemographic Databases - Harris County by Census Block - Harris County by Census Block Group - Harris County by Census Tract - Harris County Public Schools - Houston-Galveston-Brazoria, TX CMSA by Unified School District - Houston-Galveston-Brazoria, TX CMSA by ZIP Code Tabulation Area - Houston-Galveston-Brazoria, TX CMSA by Traffic Analysis Zone • Proximity Houston-Galveston-Brazoria Area Transportation Networks - Streets of Harris County • School District Demographics and ESEA Title I Funding Distributions (details) • Spring Branch ISD Census 2000 School District Profile (details) • Spring Branch ISD 1990 Census School District Profile (details) Houston area geodemographics are also featured in these webpages: • Multicultural Analysis -- http://proximityone.com/mca.htm • Neighborhoods and Geodemographic Analysis -- http://proximityone.com/nbhd.htm • Relating School Demographics and Census 2000 Demographics -- http://proximityone.com/ccd2dbf.htm Houston-Galveston-Brazoria, TX CMSA Counties [go to top] 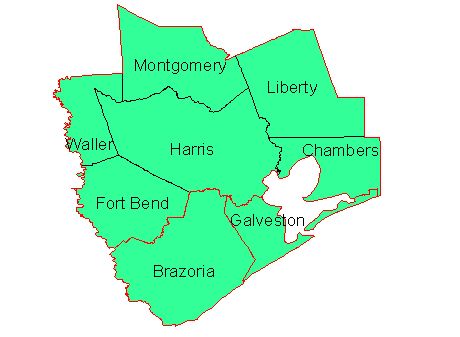 Red perimeters: PMSA boundaries: Houston, Galveston, Brazoria
Houston-Galveston-Brazoria, TX CMSA with City of Houston [go to top] 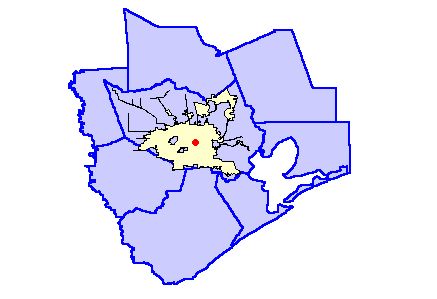 City of Houston: yellow; Site used for site demo: red dot
Census 2000 Harris County by Census Block GeoDemographic Database [to top] Download this 6.5 MB zip file (expanding to 20 MB) that the Harris County Census 2000 Census Block Database. This database includes selected items from the Proximity master census block demographics database (see http://proximityone.com/c2kblk.htm) and custom aggregates for selected age cohorts. The custom aggregates fields (for each census block, based on Census 2000) include the population 0-to-2 years of age (P02), population 3-to-5 years of age (P35), and population 5-to-17 years of age (P5_17). Other items in the shapefile dbf are described in the table presented at http://proximityone.com/dp2000et.htm. Corresponding hardcopy maps, prepared using this database, may be viewed in the related document referenced below. School District Demographics and ESEA Title I Funding Distributions [go to top] Download/View this PDF document that provides Census 2000 and related data and maps depicting selected demographic attributes of Harris County and Houston area. These data and analytical presentations are based on Proximity national scope Census 2000 demographic databases (see http://proximityone.com/c2kblk.htm) and related data from other sources. Spring Branch ISD Census 2000 School District Profile [go to top] Download a PDF document that contains the Proximity Spring Branch Independent School District Census 2000 School District Profile This type of profile is available for any school district as well as other types of geographic areas. (see http://proximityone.com/plsd.htm#2000prf). Spring Branch ISD 1990 Census School District Profile [go to top] Download/View this text document that contains the Proximity Spring Branch Independent School District 1990 Census School District Profile This type of profile is available for any school district (see http://proximityone.com/plsd.htm#1990prf). The 1990 Census school district profile differs from the Census 2000 profile in several respects. The subject matter in the 1990 Census profile is taken from the 1990 Census school district special tabulation. Corresponding data from Census 2000 are not expected to be available until early 2003. The 1990 Census profile has more "richer" and more detailed socioeconomic data that the Census 2000 profile. This is because the Census 2000 profile is based on data tabulated from the "short form" questionnaire that excludes questions on subject like income, employment, occupation, and other sample or "long form" items. Harris County, TX by Census 2000 Block Group GeoDemographic Database [top] Download this 1.2 MB zip file (expanding to 5 MB) that contains the Proximity Harris County, TX by Census 2000 Block Group GeoDemographic Database. This database dbf includes demographic subject matter items from the Proximity master database described in the table presented at http://proximityone.com/dp2000et.htm. Harris County, TX by Census 2000 Block Groups: 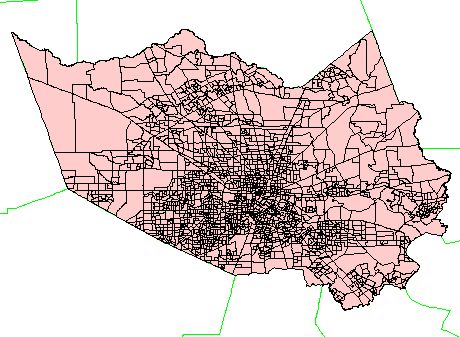
Harris County, TX by Census 2000 Block Groups: Thematic Map: Median Age blue1: 0-28.4, blue2: 28.4-33.5, white: 33.5-39.3, red1: 39.3-47.7, red2: 47.7 - 73.2 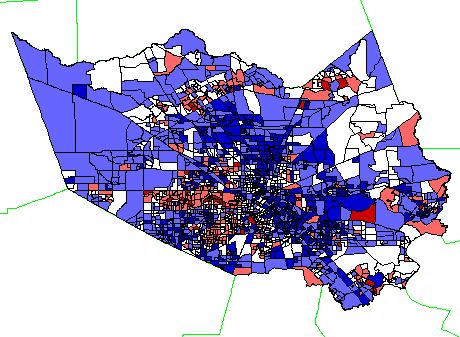
Harris County, TX by Census 2000 Census Tract GeoDemographic Database [top] Download this 0.6 MB zip file (expanding to 2 MB) that contains the Proximity Harris County, TX by Census 2000 Census Tract GeoDemographic Database. This database dbf includes demographic subject matter items from the Proximity master database described in the table presented at http://proximityone.com/dp2000et.htm. Harris County, TX by Census 2000 Census Tracts: 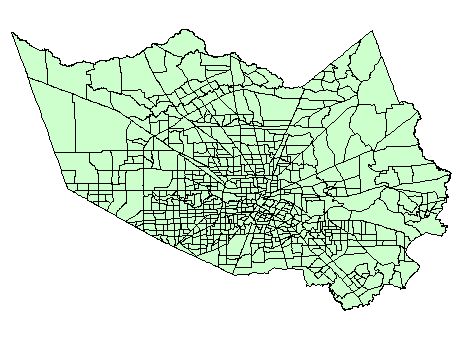
Harris County, TX by Census 2000 Census Tracts: Thematic Map: Persons per Occupied Housing Unit (darker shades, higher density) 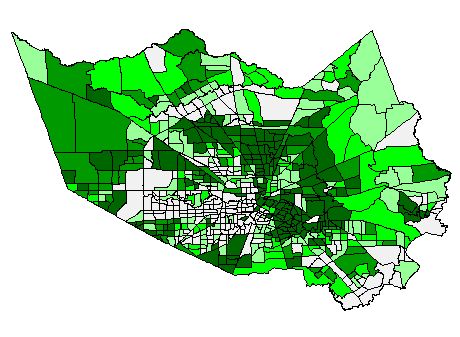
Harris County, TX Public Schools [top] Download this 190 KB zip file (expanding to 0.8 MB) that contains the Proximity Harris County, TX Public Schools (CCD) Database. This database contains attributes of public schools located in Harris County. This database was developed using 1999-2000 school year school data from the U.S. Department of Education Common Core of Data (CCD) program. Using the raw data, the school data records were address-matched and latitude-longitude fields were added to the basic data record. More information on the CCD data and the process of developing this database is available at relating school demographics to Census 2000 demographics webpage. Users of this file should note that 1) the database was developed for use in the Proximity GIS/Census 2000 WebCourse and 2) the universe of school records to be matched was 863 schools and 717 schools were address-matched with lat-lng values assigned. While the match rate could be improved, no steps were taken to meet immediate application needs. Harris County, TX Public Schools (red icons), Census 2000 Census Tracts, Streets/Roads (blue) 
Houston-Galveston-Brazoria, TX Region and CMSA by Unified School District Demographic Database [go to top] Download this 0.2 MB dbf file that contains the Proximity Census 2000 Houston-Galveston-Brazoria, TX CMSA Unified School District Demographic Database. This dbf includes demographic subject matter items from the Proximity master database described in the table presented at http://proximityone.com/dp2000et.htm. Houston-Galveston-Brazoria, TX CMSA Unified School Districts This map shows unified school districts in the HGB CMSA region. County boundaries are shown in blue. 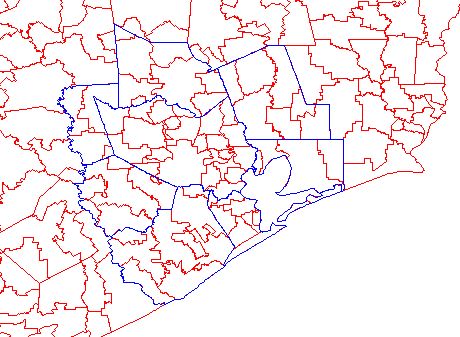
Percent Population 5-to-17 Years of Age by Unified School District Red perimeter: CMSA counties gray 3.6-18.3; yellow 18.3-19.9; green 19.9-21.5; blue: 21.5-23.7; red: 23.7-60.7 ... equal number of areas per interval (statewide unified) 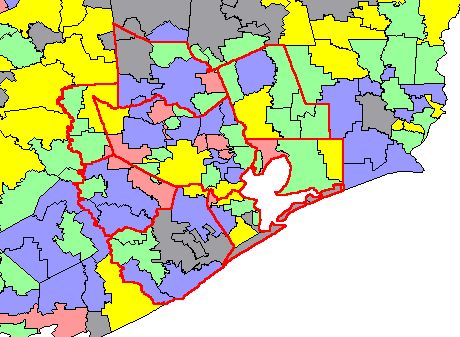
Houston-Galveston-Brazoria, TX CMSA by 5-Digit ZIP Code Tabulation Area GeoDemographic Database [go to top] Download this 0.5 MB zip file (expanding to 1.3 MB) that contains the Proximity Census 2000 Houston-Galveston-Brazoria, TX CMSA 5-Digit ZIP Code Tabulation Area GeoDemographic Database. This database dbf includes demographic subject matter items from the Proximity master database described in the table presented at http://proximityone.com/dp2000et.htm. Houston-Galveston-Brazoria, TX CMSA 5-Digit ZIP Code Tabulation Areas (zoom in to Harris County) 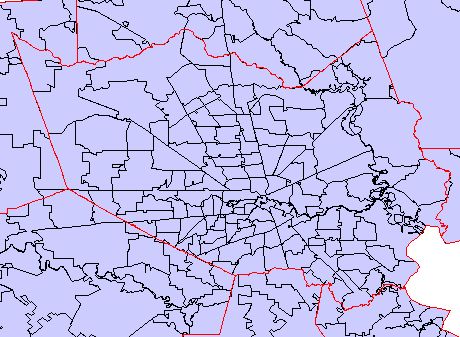
5-Digit ZIP Code Tabulation Areas Thematic Map: Percent Hispanic (darker shades, higher percentage) 0-8%, 8-18%, 18-32%, 32-56%, 56-95% 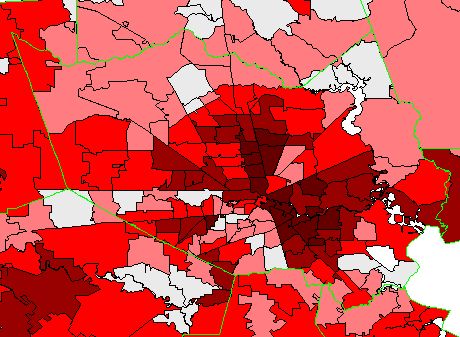
Houston-Galveston-Brazoria, TX CMSA by Traffic Analysis Zone GeoDemographic Database [go to top] Download this 1.3 MB zip file (expanding to 6.5 MB) that contains the Proximity Census 2000 Houston-Galveston-Brazoria, TX CMSA Traffic Analysis Zone GeoDemographic Database. This database dbf includes demographic subject matter items from the Proximity master database described in the table presented at http://proximityone.com/dp2000et.htm. Houston-Galveston-Brazoria, TX CMSA Traffic Analysis Zones 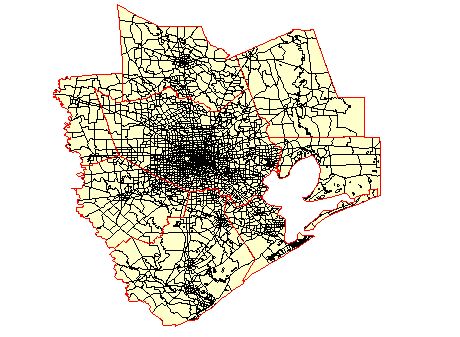
Traffic Analysis Zones: Zoom into Harris County 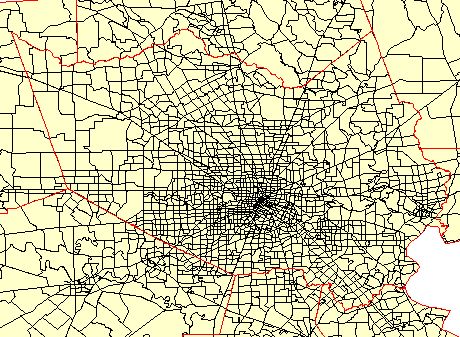
Streets of Harris County Geospatial Database [go to top] Download this 6.6 MB zip file (expanding to 31.7 MB) that contains the Proximity Census 2000 TIGER/Line file derived Harris County all streets database. Streets of Harris County Streets gray; county outline blue; unified school districts red; Spring Branch Independent School District yellow fill 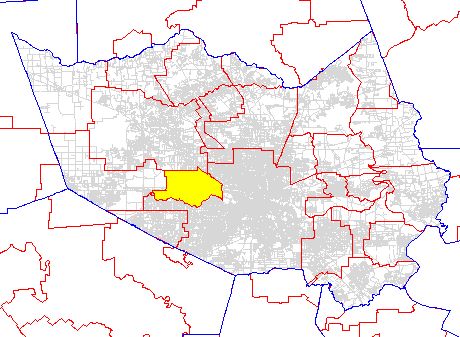
Streets of Harris County: Zoom into Spring Branch Independent School District Spring Branch ISD: red outline; schools depicted as blue icons 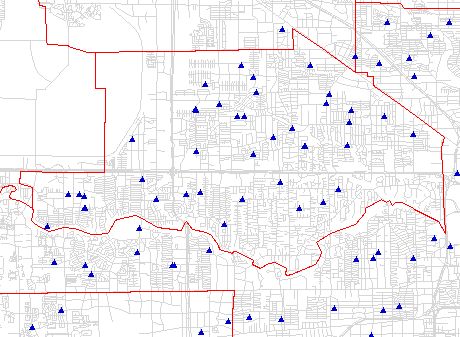
Using SiteView in Harris County [go to top] This section is under development. The table presented below depicts a "site profile" for two "site areas" in Harris County. This table has been generated using the Proximity Siteview software. Soon a version of the SiteView software and corresponding C2KBLK database (Census 2000 data for all census blocks) will be referenced in this section for downloading and use. Consider this analytical scenario. An analyst seeks to determine the demographic profile for a circular area of radius 1 mile and 2.5 miles from a specific location near the center of Houston. The site is defined by latitude-longitude as depicted in the map of the HGB CMSA shown earlier in this page. These site parameters are provided to SiteView which performs an analysis on all Harris County census blocks ... determining if the census block is located within or outside the site area. The demographics are then aggregated for census blocks included in the site areas and presented as a summary report. The summary report was then saved as a web page and presented below.
Houston-Galveston-Brazoria, Texas Consolidated Metropolitan Statistical Area [go to top] Metropolitan Area. The general concept of a metropolitan area (MA) is one of a large population nucleus, together with adjacent communities that have a high degree of economic and social integration with that nucleus. Some MAs are defined around two or more nuclei. The MAs and the central cities within an MA are designated and defined by the federal Office of Management and Budget (OMB), following a set of official standards that are published in a Federal Register Notice. These standards were developed by the interagency Federal Executive Committee on Metropolitan Areas, with the aim of producing definitions that are as consistent as possible for all MAs nationwide. Each MA must contain either a place with a minimum population of 50,000 or a U.S. Census Bureau-defined urbanized area and a total MA population of at least 100,000 (75,000 in New England). An MA contains one or more central counties. An MA also may include one or more outlying counties that have close economic and social relationships with the central county. An outlying county must have a specified level of commuting to the central counties and also must meet certain standards regarding metropolitan character, such as population density, urban population, and population growth. In New England, MAs consist of groupings of cities and towns rather than whole counties. The territory, population, and housing units in MAs are referred to as "metropolitan." The metropolitan category is subdivided into "inside central city" and "outside central city." The territory, population, and housing units located outside territory designated "metropolitan" are referred to as "nonmetropolitan." The metropolitan and nonmetropolitan classification cuts across the other hierarchies; for example, generally there are both urban and rural territory within both metropolitan and nonmetropolitan areas. To meet the needs of various users, the standards provide for a flexible structure of metropolitan definitions that classify each MA either as a metropolitan statistical area (MSA) or as a consolidated metropolitan statistical area (CMSA) divided into primary metropolitan statistical areas (PMSAs). CMSA. If an area that qualifies as a metropolitan area (MA) has more than one million people, two or more primary metropolitan statistical areas (PMSAs) may be defined within it. Each PMSA consists of a large urbanized county or cluster of counties (cities and towns in New England) that demonstrate very strong internal economic and social links, in addition to close ties to other portions of the larger area. When PMSAs are established, the larger MA of which they are component parts is designated a consolidated metropolitan statistical area (CMSA). CMSAs and PMSAs are established only where local governments favor such designations for a large MA. Central City. In each metropolitan statistical area and consolidated metropolitan statistical area, the largest place and, in some cases, additional places are designated as "central cities" under the official standards. A few primary metropolitan statistical areas do not have central cities. The largest central city and, in some cases, up to two additional central cities, are included in the title of the metropolitan area (MA); there also are central cities that are not included in an MA title. An MA central city does not include any part of that place that extends outside the MA boundary. Metropolitan Area Title and Code. The title of a metropolitan statistical area (MSA) contains the name of its largest central city and up to two additional place names, provided that the additional places meet specified levels of population, employment, and commuting. Generally, a place with a population of 250,000 or more is in the title, regardless of other criteria. The title of a primary metropolitan statistical area (PMSA) may contain up to three place names, as determined above, or up to three county names, sequenced in order of population size, from largest to smallest. A consolidated metropolitan statistical area (CMSA) title also may include up to three names, the first of which generally is the most populous central city in the area. The second name may be the first city or county name in the most populous remaining PMSA; the third name may be the first city or county name in the next most populous PMSA. A regional designation may be substituted for the second and/or third names in a CMSA title if local opinion supports such a designation and the federal Office of Management and Budget (OMB) deems it to be unambiguous and suitable. The titles for all metropolitan areas (MAs) also contain the U.S. Postal Service's abbreviation for the name of each state in which the MA is located. Each MA is assigned a four-digit Federal Information Processing Standards (FIPS) code, in alphabetical order nationwide. If the fourth digit of the code is "2," it identifies a CMSA. Additionally, there is a separate set of two-digit FIPS codes for CMSAs, also assigned alphabetically. GeoDemographic Database Concepts and Terminology [go to top] The geodemographic databases are each a set of three files comprising the geographic attributes of the areas represented (*.shp and *.shx) and mixed geographic and demographic data structured in dbase4 (*.dbf). When the geodemographic database zip files are expanded these three file types (in some instances other files as well) are created. These three files must be stored in the same folder. The set of three geodemographic database files are structured in "shapefile" format and may be used with any mapping/GIS software that supports use of shapefiles for mapping. The geodemographic database dbase4 file (*.dbf) may be used by any application program designed to process dbase4 file structures. As examples, they may be opened in Access and Excel. The dbase file contains many geographic code (geocode) fields as well as demographic data fields. Subject matter items in the dbase files are described in the table presented at http://proximityone.com/dp2000et.htm. The Harris County census block level database contains a subset of these fields as described in that file section. You may find it necessary to access/acquire related files that contain the name of the geographic area (e.g., the city name) that corresponds to the geocode (e.g., place code). Proximity has these cross reference files available. You can also refer the the "FIPS" code reference materials located at http://www.itl.nist.gov/fipspubs/by-num.htm for codes which are FIPS codes. [go to top] |
|
|