|
|


Kansas Applications |

|

|

|

|

|
||
|
Kansas Applications |
|
|
|

|

|

|
Kansas Applications
|
|
|
Kansas Applications |
|
|
|
|
|
||
|
Kansas Applications |
|
|
|
|
|
|
|
|
||
This section provides examples of using M2 with PCT12 data for Kansas counties and school districts.
See Gallery sections relating to geography/demographics also covered in this section:
| • | Kansas by county and school district -- http://proximityone.com/gallery/guide/index.htm?kansas.htm |
| • | Shawnee Mission School District -- http://proximityone.com/gallery/guide/index.htm?ks_shawnee.htm |
The toggle graphic -- ![]() -- and text colored in this manner indicate an expanding section.
-- and text colored in this manner indicate an expanding section.
Click the toggle or toggle line to view/close expanding sections.
Data were downloaded from FF2 for all Kansas counties and school districts. FF2 puts the data for both types of geography together in one set of FactFinder "DEC" files. See more about the FF2 "DEC" CSV files in Creating M2 Datasets section.
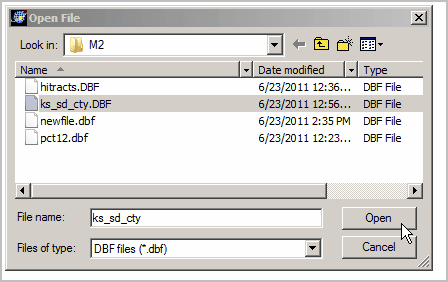
File>Open is used to open the Kansas M2 dataset (c:\m2\ks_sd_cty.dbf).
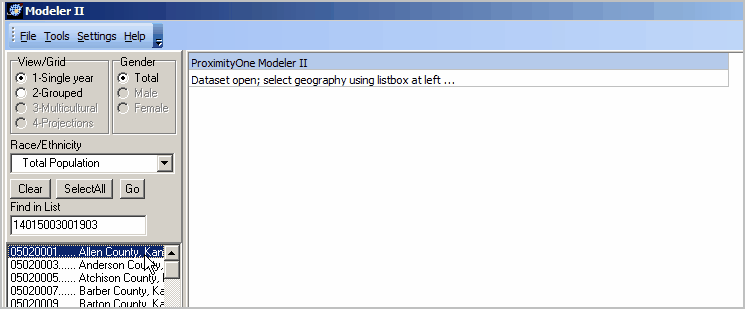
The dataset opens, ready to select areas and view/analyze data.
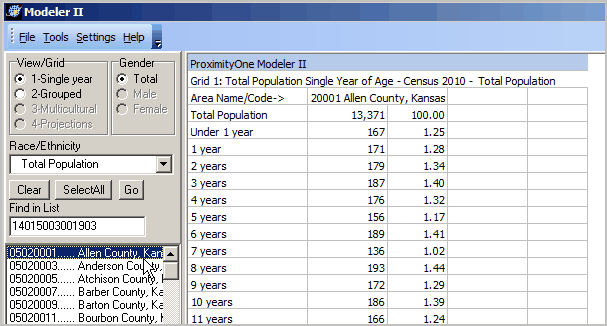
Dbl-click one area, the top entry ... Allen County.
|
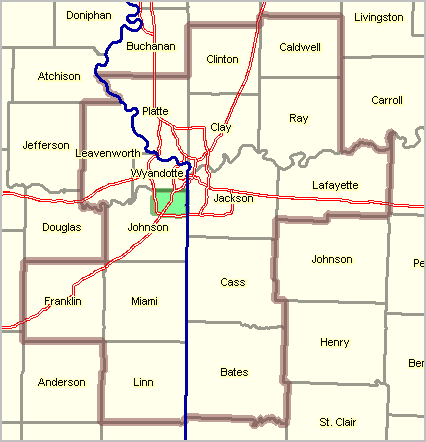
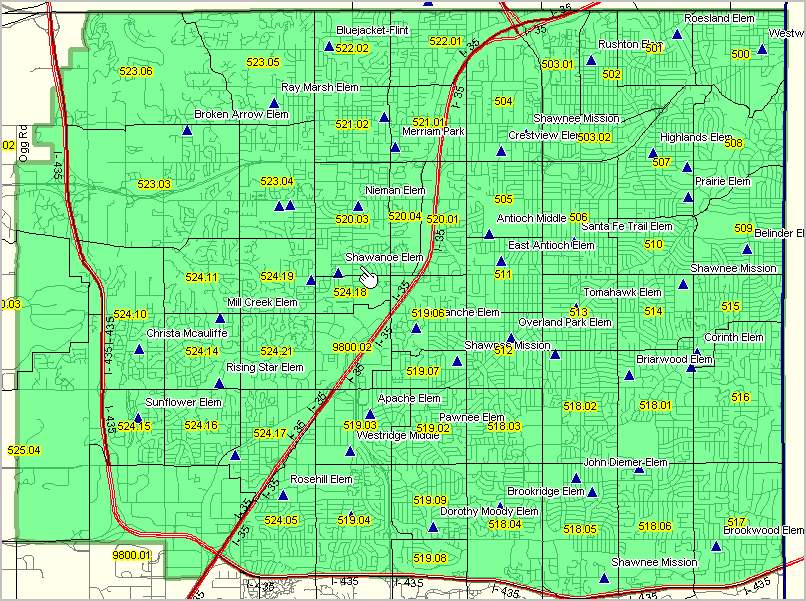
Examining School Service Area using M2 with Census Tract Demographics
Shawnee Mission school district (green fill pattern) in context of Kansas City MSA (bold brown boundary)
Zoom-in view of Shawnee Mission School District. See pointer and location of Shawanoe El School near/on boundaries of tracts 520.03 and 524.18.
|
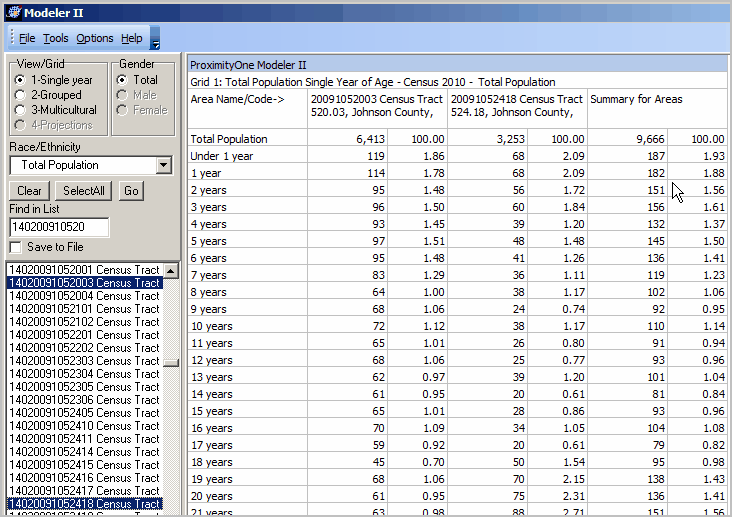
Shawanoe El School near/on boundaries of tracts 520.03 and 524.18. The following M2 Grid2 shows total population single year of age characteristics of these two tracts and their aggregate. While this geography is not intended to exactly match the exact school attendance zone, it illustrates how these resources can be used to analyze detailed age patterns in small area where a school is located. This example only uses two tracts; an unlimited number can be used. This is a partial view ... single year of age continues to 100+. See Grid2 age groups view in the Kansas school district views below.
Total population, age 1 as of Census 2010, was 182 for the sum of both tracts (see pointer). 59 of these children were Hispanic. See separate Hispanic population Grid1 view below.
|
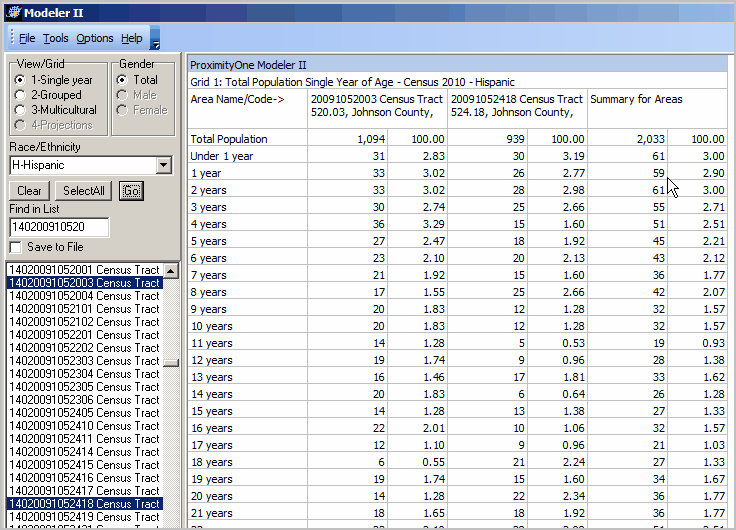
Shawanoe El School near/on boundaries of tracts 520.03 and 524.18. The following M2 Grid2 shows Hispanic population single year of age characteristics of these two tracts and their aggregate. While this geography is not intended to exactly match the exact school attendance zone, it illustrates how these resources can be used to analyze detailed age patterns in small area where a school is located. This example only uses two tracts; an unlimited number can be used. This is a partial view ... single year of age continues to 100+. See Grid2 age groups view in the Kansas school district views below.
Total population, age 1 as of Census 2010, was 182 for the sum of both tracts (see pointer in above Grid1 view). 59 of these children were Hispanic (see pointer).
|
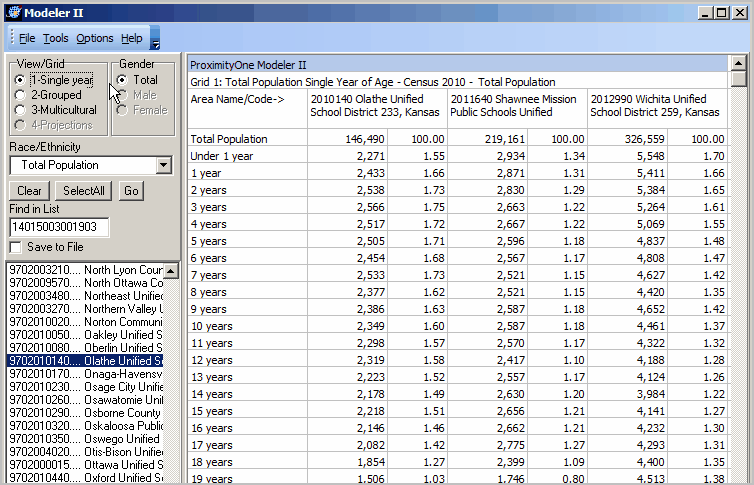
Kansas School District Patterns & Comparative Analysis
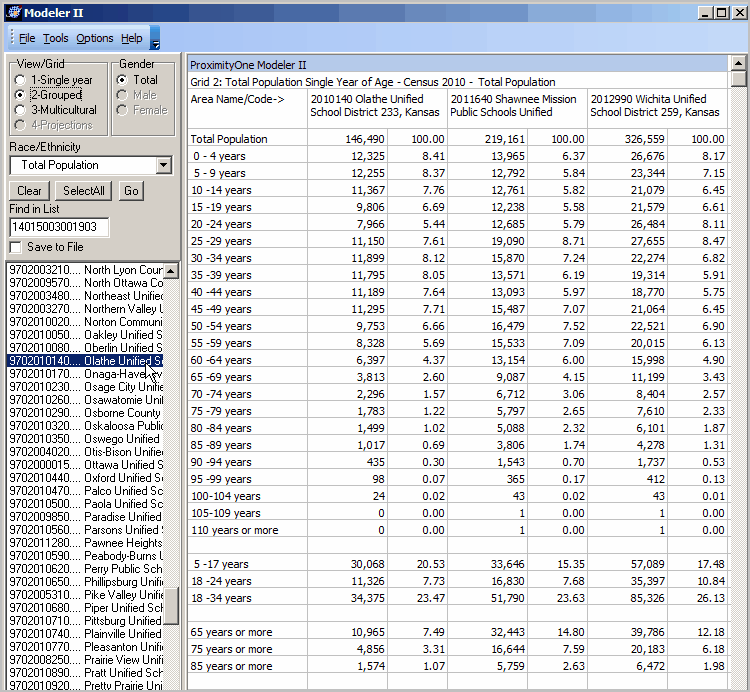
Side by Side Comparison of Three of Kansas Largest School Districts -- Single Year of Age. To replicate this view (using M2 on your computer), click Clear then multi-select the three school districts Olathe, Shawnee Mission and Wichita.
|
Side by Side Comparison of Three of Kansas Largest School Districts -- Age Groups To replicate this view using M2 on your computer, click Grid2 radiobutton -- upper left in View/Grid shown in the following view.
|
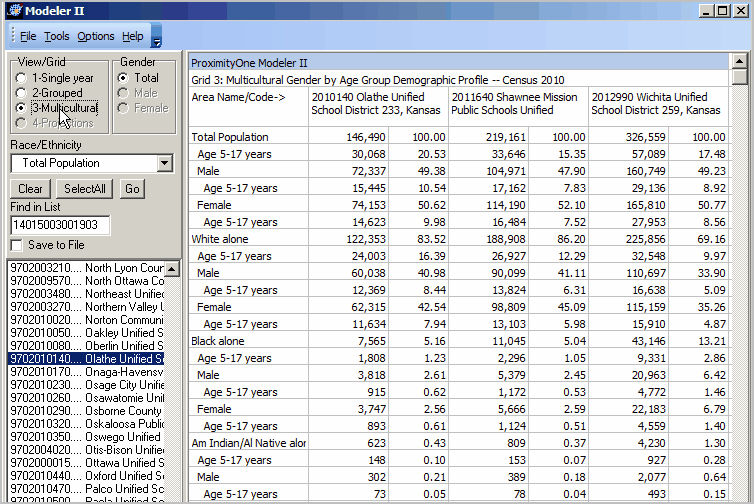
Side by Side Comparison of Three of Kansas Largest School Districts -- Age Groups To replicate this view using M2 on your computer, click Grid3 radiobutton -- upper left in View/Grid shown in the following view.
|
The content of the following table is the same as above. This HTML table is generated while the above display is active and the File>SaveGrid as HTML feature is used. The table is created as a standalone HTML document that can then be used to publish the data on a Website or otherwise.
|
|||||||||||||||||||||||||||||||||||||||||||||||||||||||||||||||||||||||||||||||||||||||||||||||||||||||||||||||||||||||||||||||||||||||||||||||||||||||||||||||||||||||||||||||||||||||||||||||||||||||||||||||||||||||||||||||||||||||||||||||||||||||||||||||||||||||||||||||||||||||||||||||||||||||||||||||||||||||||||||||||||||||||||||||||||||||||||||||||||||||||||||||||||||||||||||||||||||||||||||||||||||||||||||