|
|


Overview |

|

|

|

|

|
||
|
Overview |
|
|
|

|

|

|
Overview
|
|
|
Overview |
|
|
|
|
|
||
|
Overview |
|
|
|
|
|
|
|
|
||
| Decision-Making Information | |
|
ProximityOne information resources & solutions (888) DMI-SOLN (888) 364-7656 |
Analyzing Census 2010 population by single year of age variations ...
| • | aggregating single year of age by gender/race-ethnicity over selected census tracts/study area. |
| • | side-by-side comparative analysis of age patterns for selected geographies (e.g., one city to another). |
| • | assessing policy implications ... prospective program impact on selected age groups. |
| • | custom groupings of single year of age demographics. |
| • | creating lowest common denominator age data for health analyses. |
| • | examining patterns of the under age 5 population; planning for K-12 education. |
Navigate to sub-state areas: click on expanding text menu in left panel to view available sections.
The toggle graphic -- ![]() -- indicates an expanding section. Click the toggle or toggle line to view/close expanding sections.
-- indicates an expanding section. Click the toggle or toggle line to view/close expanding sections.
This document describes use of the Modeler II to perform these types of operations/analyses using Census 2010 data. Modeler II is a component of the ProximityOne Situation & Outlook integrated software and database. Modeler II (M2) is focused on age cohort analysis. M2 has many features that can operate in an independent manner, not requiring integration with other parts of S&O. This document is focused on the Windows-based M2 used in a standalone form without any other software or dependencies.
M2 is used to analyze of Census 2010 population by age, gender and race/ethnicity using Census 2010 Table PCT12 data. See details about Table PCT12. The Level 1 version of M2 software is available at no fee. PCT12 data may also be acquired using the Census Bureau FactFinder method of downloading the data (step-by-step details more below). Alternatively, state or national scope ready-to-use M2 datasets are available from ProximityOne on a fee-basis. Contact us for more information (mention M2 and age cohort analysis).
M2 and PCT12 Data
The decennial census Summary File 1 (SF1) Table "PCT12" single year of age population data are widely used by many types of organizations for many types of applications. This table/set of data uniquely provides access to "lowest common denominator" single year of age detail from under 1 year to 100 years of age for wide-ranging geographic areas enabling users to construct age cohort data not otherwise available. Table PCT12 is replicated for several race/ethnic combinations adding to analytical possibilities. More detail about Table PCT12 is provided below. Single year of age data are are essential in many demographic analyses and the development of projections.
The Census 2010 SF1 PCT12 table items and iterations are identical to those of Census 2000 SF1 PCT12 adding capability for longitudinal analysis.
Note that Census 2010 SF1 data are released on a state by state basis and may not yet be available for areas of interest. See http://proximityone.com/cen2010_sf1.htm for details.
Some Initial Views
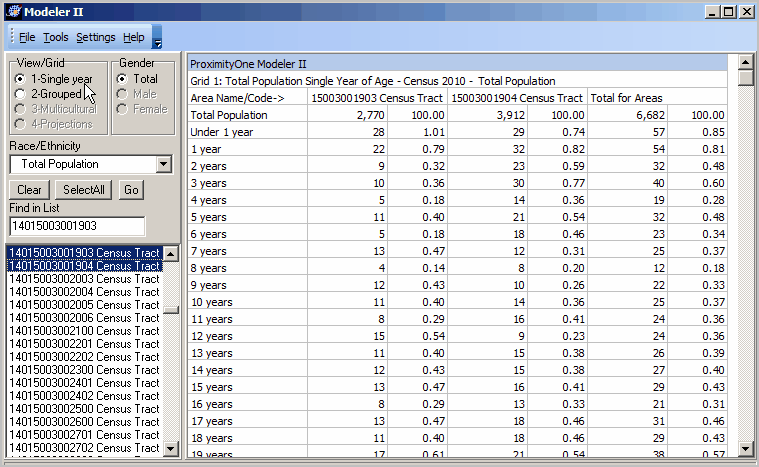
The following map shows one Census 2000 tract (blue boundary, tract 001902) and corresponding two Census 2010 tracts (red boundary). Census 2000 tract 001902 was split to create Census 2010 tracts 001903 and 001904 (001902 no longer exists as a Census 2010 tabulation area). For more about these Hawaii tracts and census tracts in general see http://proximityone.com/tracts0010.htm. Located in Honolulu County (FIPS code 001) of Hawaii (FIPS code 15), the full uniquely identifying Census 2010 census tract geocodes are 15003001903 and 15003001904. What are the detailed age distributions/characteristics for these tracts? How is the population composition changing in these tracts post-Census 2010?

Using M2, the single year of age data is shown in this view (Grid 1) for each tract and the sums for the two tracts.
See tract code in cell by pointer.
|
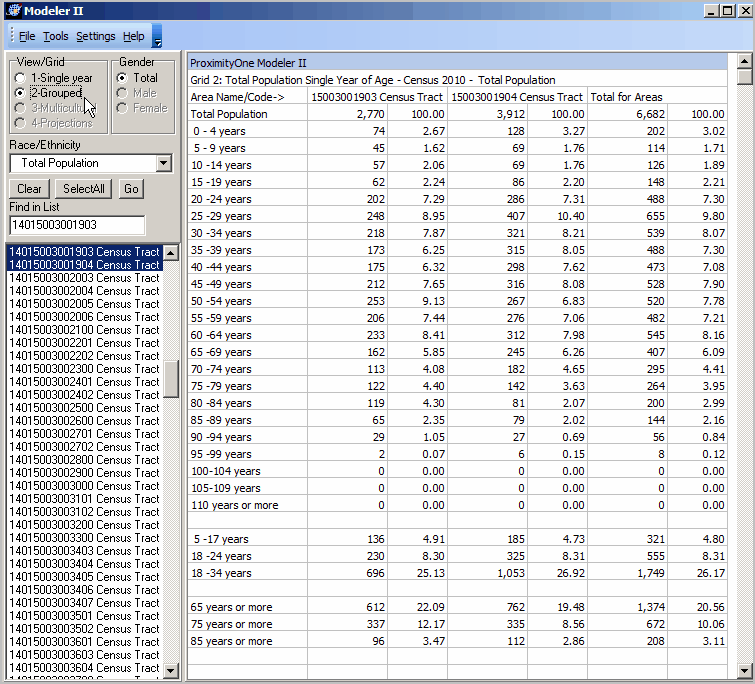
Clicking the radiobutton in Grid Selection and selecting Grid 2-Grouped, data are shown for the same geography for selected age groups in the Grid2 view.
|
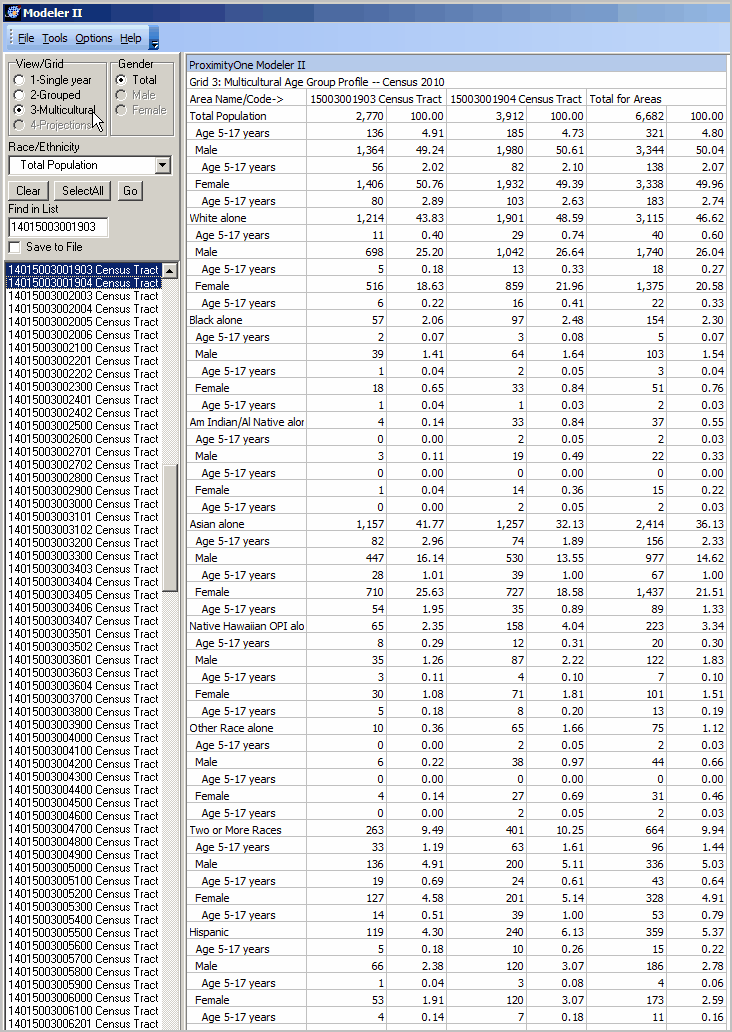
The multicultural profile (Grid 3) displays the total, male and female population for each of the 9 race/ethnic categories and also for a user specified age range for each of those combinations.
|
Using PCT12 Data with M2
While the Census Bureau FactFinder (FF2) can be used to "call-up" and display/download the PCT12 data, it is difficult to use the data directly, or even open with a tool such as Excel, and easily view the data. The age detail is iterated by gender and cumbersome to aggregate by gender. To compare aggregated gender data for one area to another is tedious. Labeling the age detail can be time consuming and challenging. Computing percentages requires additional steps. Aggregating the data for areas of interest, such as a study area comprised of 5 census tracts, requires more time. These are features supported by the no-fee version of M2. These are also basic features required for the "next step" primary purpose of M2 -- developing population projections by age-gender-race/ethnicity for cities/places, towns, school districts, congressional districts, ZIP code tabulation areas, census tracts and higher level aggregates of census tracts (including counties, metros, states).
Examples shown here are based on all tracts in two states. However, any geography (subject to FF2 limitations) can be used. All census tract "higher level" geographies can be used as well as cities/places, school districts, congressional districts and ZIP code tabulation areas.
To use S&O M2, the Census 2010 Summary File 1 (SF1) PCT 12 Table(s) must be on your computer. Options are to download these data from FactFinder (no cost) or purchase the ready-to-use data from ProximityOne (inquire for information on pricing and available geographies).