
|
|
CountyTrends Main Page County Labor Force, Employment & Unemployment |
MacroView: Analyze Job Gains, Losses & Opportunities by Area by Sector -- Employment, Establishments & Earnings -- 2009 Annual Characteristics -- Use tools in this section to analyze patterns in areas of interest.
The MacroView interactive ranking table presented below illustrates how you can analyze employment, establishments, and earnings for selected counties, metros, states and the U.S. The annual 2009 data are for high level industries and based on employer reported data from the quarterly census of employment and wages. More about these data. Example ... you can see that the 2009 average annual pay for the financial services sector in New York county, was $212,475 with 350,000 employment in 18,800 establishments ... how? click ShowAll button, select New York, select Financial sector, dbl-click AnnualPay$ header and you will view the ranked areas. Proximity integrates quarter to quarter data into a time-series structure and augments these data with related data to enable situation and outlook analyses for counties, metros and regions. Contact Proximity (888-364-7656) with questions about data covered in this section or to discuss custom estimates, projections or analyses for your areas of interest. MacroView: 2009 Establishments, Employment & Wages ... Patterns by Sector by State, County & Metro ... Interactive ranking table -- view, sort, compare areas of interest ... see usage notes below table. Click column header to sort; click again to sort other direction ... first use State select, OwnInd select or Find. See related ranking tables Usage Notes • Click on column header to sort on that column; click column header again to sort in other direction. • Click ShowAll button to show all areas and restore full set of data view. • Click State to view metros in a selected state (click ShowAll between selections). • Find by AreaName: key in partial area name in text box to right of Find-in-AreaName button then click button to locate all matches (case sensitive). • See related ranking tables. Column Headers • AreaType -- Nation, State, County, MSA • StName -- state name • AreaName • Owner -- total, government, private • Industry -- high level industry • Code -- suppression (N) code • Establishments -- average number of eatablishments 2009 • Employment -- average employment 2009 • TotalWages$ -- total wages 2009 • WeeklyWages$ -- average weekly wages 2009 • AnnualPay$ -- average annual pay 2009 • EmpLQ -- employment location quotient • WageLQ -- total wage location quotient Location Quotients. The location quotients are calculated as a comparison of the percent of private sector activity (employment or total wages) in the particular industry of that row compared to the percent of private sector activity that same industry comprises of U.S. total private activity. Location Quotients (LQs) are ratios that allow an area's distribution of employment by industry to be compared to a reference or base area's distribution. The reference area is usually the U.S., but it can also be a state or a metropolitan area. The reference or base industry is usually the All industry total. The discussion below assumes the defaults are used. LQs also allow areas to be easily compared to each other. If an LQ is equal to 1, then the industry has the same share of its area employment as it does in the reference area. An LQ greater than 1 indicates an industry with a greater share of the local area employment than is the case in the reference area. For example (assuming the U.S. as the reference area), Las Vegas will have an LQ greater than 1 in the Leisure and Hospitality industry because this industry makes up a larger share of the Las Vegas employment total than it does for the country as a whole. LQs are calculated by first, dividing local industry employment by the all industry total of local employment. Second, reference area industry employment is divided by the all industry total for the reference area. Finally, the local ratio is divided by the reference area ratio OwnInd -- Owner-Industry Selection Button • Total, All Industries • Goods-Producing • Natural Resources and Mining • Construction • Manufacturing • Service-Providing • Trade, Transportation, and Utilities • Information • Financial Activities • Professional and Business Services • Education and Health Services • Leisure and Hospitality • Other Services • Unclassified Example The graphic below shows a table view of Arizona areas/counties sorted by annual pay for the information high level industry. The table may be used to generate this type of view for any state for any industry sorted on any column. This view shows that Maricopa County had the highest annual pay ($58,597) among all counties for the information industry in 2009. To obtain this view, click ShowAll button, select Arizona (State dropdown), select Information industry (Industry dropdown) and finally click on the AnnualPay$ column header to sort the selected rows (sort in ascending or descending order). 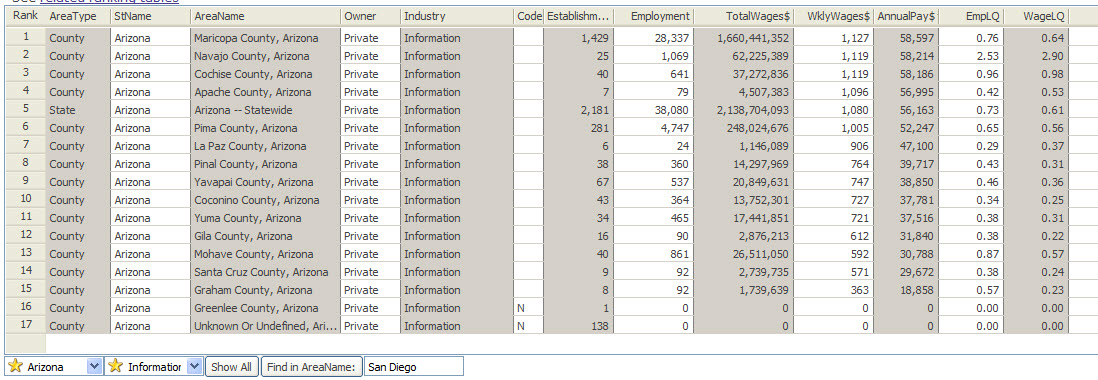
More About the Data All data are by place of work. Data relate to establishments and employment covered by the unemployment insurance program. Covered employment provided a virtual census (estimated to be 97 percent) of jobs on nonfarm payrolls. The U.S. Economic Classification Policy Committee has defined major economic sectors, or supersectors, as highly aggregated groupings of NAICS sectors. Supersectors, or high level industries, are used by Federal statistical agencies to tabulate data about business activity and serve as a basis for analyzing more macro groupings of economic activity by type of business. See details. Additional Information Proximity develops geodemographic-economic data and analytical tools and helps organizations knit together and use diverse data in a decision-making and analytical framework. We develop custom demographic/economic estimates and projections, develop geographic and geocoded address files, and assist with impact and geospatial analyses. Wide-ranging organizations use our tools (software, data, methodologies) to analyze their own data integrated with other data. Contact Proximity (888-364-7656) with questions about data covered in this section or to discuss custom estimates, projections or analyses for your areas of interest. |
|
|