|
SDDynamics Software, Database & Analysis |
  
|
| Show/Hide Hidden Text |
|
SDDynamics Software, Database & Analysis |
|
| Show/Hide Hidden Text |
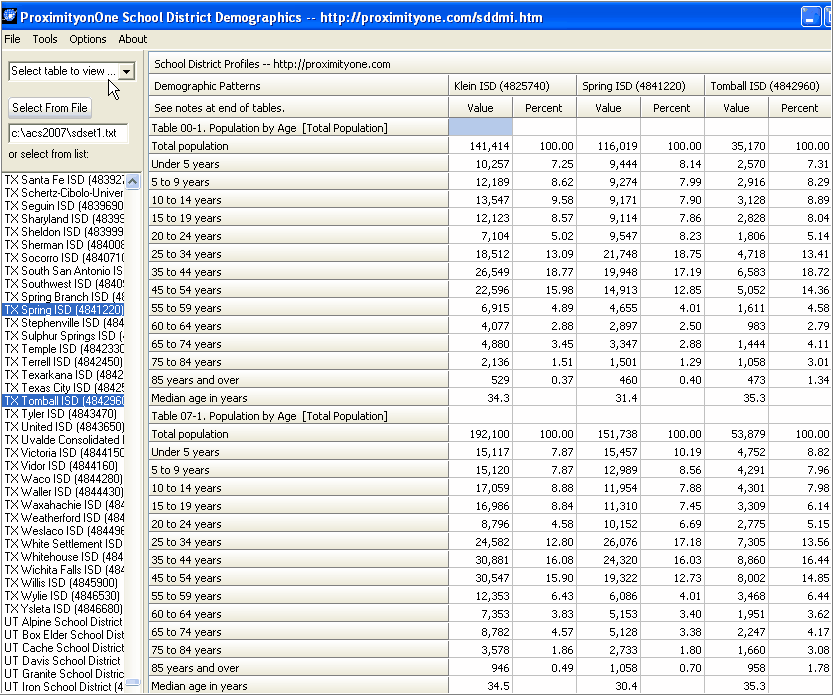
Use the SDDynamics software and database (Win32 application) to examine and compare updated demographics for school districts optionally in the context of corresponding metropolitan area and state. Compare the 2005-07 estimates with corresponding Census 2000 data (see earlier section tables). Klein ISD, TX, for example, has increased in total population from 141,414 to 192,100. How has the total resident population ages 5-17 years changed? How has the K-12 enrollment participation rate changed over the period? How does this district compare to peer districts?
SDDynamics Data Access, Views and Analyses. The following [toggle] view shows side-by-side demographic profiles for three districts. Table 00-1 shows the Census 2000 population by age. Table 07-1 shows the ACS 05-07 population by age.
|
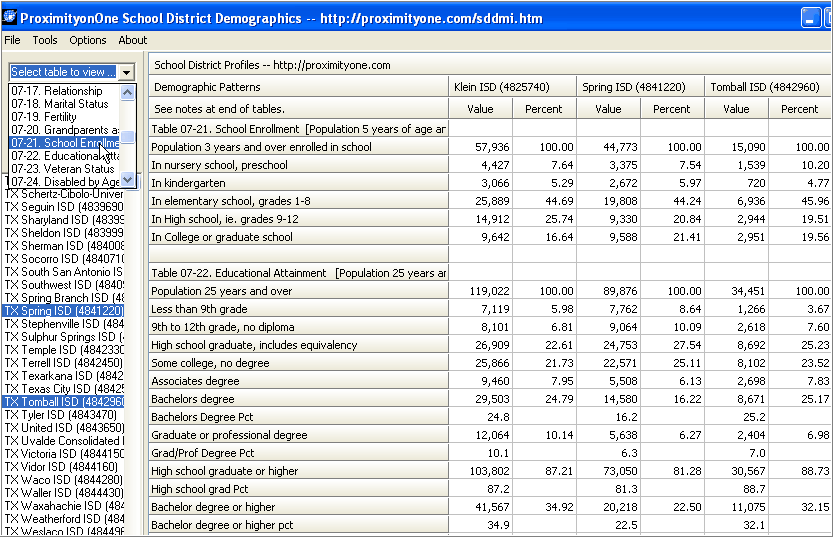
Use the Table to view feature, as illustrated below, to view a specific table of interest (select from tables listed above). In this example, the 05-07 ACS estimates for school enrollment and educational attainment are shown.
|
SDDynamics Browser
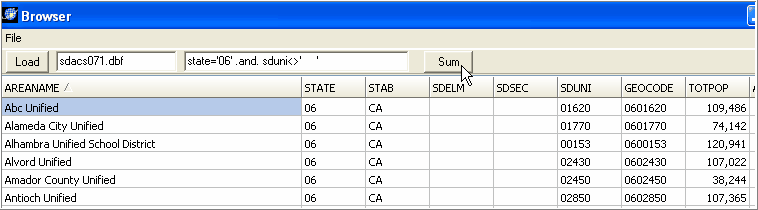
The SDDynamics Browser feature enables spreadsheet style operations where a row contains attributes of a geographic area. Once the spreadsheet is loaded, the selection of districts/areas can be sorted on an item of interest and columns summed. Invoke via the Tools>Browse feature.
Click the Load button to populate the grid with the file sdacs071.dbf and include only those records that match the criteria [state='06' .and. sduni<>' '].
|
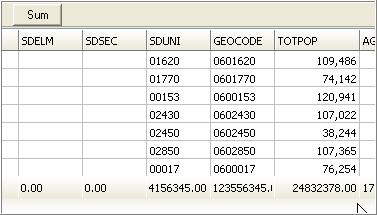
Click the Sum button to sum fields as shown below. the TOTPOP field/column has been resized with mouse to view larger field sum value 24,832,378, the sum of the total population of all California unified school districts.
|
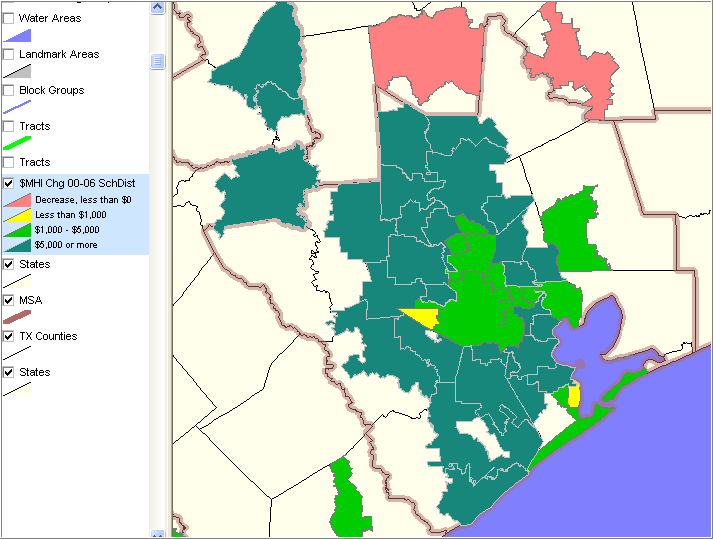
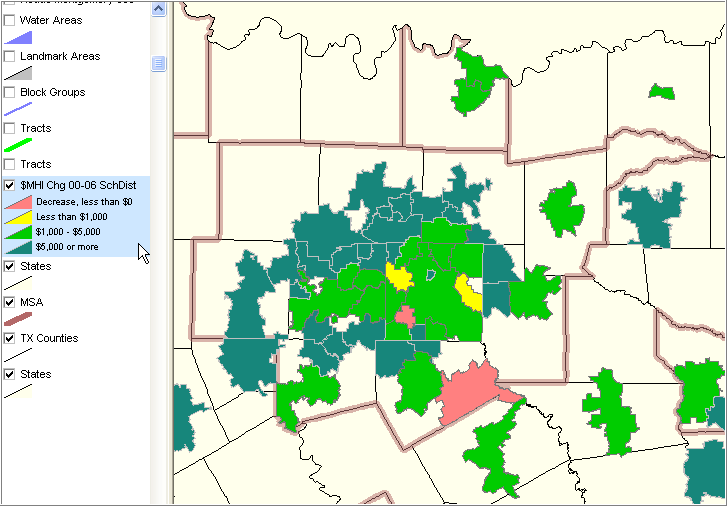
Thematic Mapping
Examples of thematic mapping/pattern analysis using CommunityViewer GIS with the SDDynamics dataset.
School Districts with Population 20,000 and over Change in Median Household Income 2005-07$MHI-1999$MHI
|
School Districts with Population 20,000 and over Change in Median Household Income 2005-07$MHI-1999$MHI
|
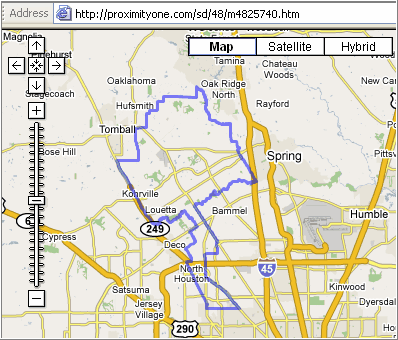
Web-based Reference and Orienteering Maps
With SDDynamics running, click on the Options>Show Map feature to enable automatic maps viewing of a school district or MSA. When a school district is selected by dbl-click on name in listbox, the school district boundary shows in an interactive Google map.
|
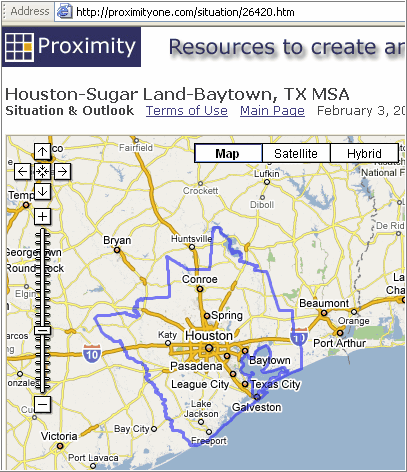
When a MSA is selected by dbl-click on name in listbox, the MSA boundary shows in an interactive Google map.
|
The map is displayed in the currently open browser window. Two successive map views will therefore use the same browser window. If you do not want the current browser window to be used, open another browser window and make it active. The map will be displayed in that window. Use this method to display two school districts of interest or a school district and related metro. Only MSA maps are shown. MISA maps are not supported with this version.
Page url: http://proximityone.com/sddynamics/guide/index.htm?freeway.htm