|
Introduction |
  
|
| Show/Hide Hidden Text |
|
Introduction |
|
| Show/Hide Hidden Text |
Proximity SDDynamics
-- resources to assess school district characteristics and patterns
| Decision-Making Information | |
|
Contact Proximity for information resources and solutions ... (888) DMI-SOLN (888) 364-7656 |
For the approximate largest 3,300 school districts with population 20,000 and over, wide-ranging demographic updates are available (as of 12/8/08) from the 2005-07 "3-Year" Census Bureau American Community Survey (ACS). A main importance of these data is that they are the first set of wide-ranging demographic data available for this larger set of school districts since Census 2000. ACS data for approximately 900 school districts with population 65,000 or more are included in the annual ACS data releases. They enable assessment of more recent characteristics than provided by Census 2000. They enable assessment of how some demographic measures have changed since 2000. There are a few new types of measures that can provide different insights.
This document reviews access to and use of these demographic updates and use of the Proximity SDDynamics software and database to combine and analyze these and related data. Users of SDDynamics demographic updates should review the ACS data usage notes. See more about analyzing these data in the context of other geography and subject matter in the Texas Decision-Making Information Guide.
ACS Data Availability and Reliability
The population threshold of 20,000 is required as reliable estimates for smaller population areas cannot be developed from the ACS survey design. More attention to reliability of estimates is required as compared to sample based estimates from the decennial census. Some relative sense of the Margin of Error should be kept in mind while using these data.
ACS Data Access and Analysis
While these data are readily accessible using the Census Bureau FactFinder, they are quite difficult to use in an analytical manner. For example, there is no facility to "browse across" or sort school districts using a dataset/extract of these data. There is no facility to view these data as thematic maps to visually examine patterns. There is no facility to integrate other related data. This section reviews Proximity software and integrated data focused on accessing, viewing and analyzing these data. Applications shown here focused on Texas can be produced for any region using the same toolset.
ACS Subject Matter
The SDDynamics database includes ACS 05-07 subject matter tables listed below. Specific subject matter items are listed here: http://proximityone.com/txdmi/acs3yrtables.xls. Item names listed in the first column are also the dbase file names used in CommunityViewer for GIS analyses. The SDDynamics database also includes Census 2000 subject matter items described here: DP1 DP2 DP3 DP4
Table 07-1. Population by Age [Total Population] Table 07-2. Age and Gender [Total Population] Table 07-3. Race [Total Population] Table 07-4. Hispanic or Latino (any race) [Total Population] Table 07-5. Household Income and Benefits (2007 inflation adjusted dollars) [Total] Table 07-6. Family Income and Benefits (2007 inflation-adjusted) [Family Households] Table 07-7. Other Income Measures (2007 inflation adjusted dollars) [Total Households] Table 07-8. Poverty Status (over last 12 mo) [Persons for whom poverty status determined] Table 07-9. Employment Status [Population 16 years and over] Table 07-10. Children With All Parents Working [Own Children] Table 07-11. Commuting to Work [Workers 16 years and over] Table 07-12. Workers by Occupation [Civilian employed population 16 years and over] Table 07-13. Workers by Industry [Civilian employed population 16 years and over] Table 07-14. Class of Worker [Private wage and salary workers] Table 07-15. Households by Type [Total households] Table 07-16. Persons by Household Type/Group Quarters [All Persons] Table 07-17. Relationship [Household population] Table 07-18. Marital Status [Persons 15 years and over] Table 07-19. Fertility [Women 15-50 years old who gave birth in the past 12 mo] Table 07-20. Grandparents as Caregivers [Grandparents living with own grandchildren] Table 07-21. School Enrollment [Population 5 years of age and over] Table 07-22. Educational Attainment [Population 25 years and over] Table 07-23. Veteran Status [Civilian population 18 years and over] Table 07-24. Disabled by Age [Civilian Noninstitutionalized population over 5] Table 07-25. Residence 1 Year Ago [Population 1 year of age and older] Table 07-26. Place of Birth and Citizenship Status [Total population] Table 07-27. Year of Entry [Population born outside the U.S.] Table 07-28. World Region of Birth of Foreign Born [Foreign-born population, excl population born at sea] Table 07-29. Language Spoken at Home [Population 5 years and over] Table 07-30. Housing Occupancy and Tenure [Total housing units] Table 07-31. Units in Structure [Total housing units (including vacant)] Table 07-32. Year Structure Built [Total housing units] Table 07-33. Year Householder Moved into Unit [Occupied housing units] Table 07-34. Vehicles Available [Occupied housing units] Table 07-35. House Heating Fuel [Occupied housing units] Table 07-36. Selected Characteristics [Occupied housing units] Table 07-37. Occupants per Room [Occupied housing units] Table 07-38. Home Values [Owner-occupied units] Table 07-39. Selected Monthly Owner Costs [Owner Occupied units] Table 07-40. Gross Rent [Renter-occupied units]
|
Geography
The SDDynamics database includes:
- the approximate 3,300 school districts with population 20,000
- all CBSAs -- Core-Based Statistical Areas (MSAs and MISAs)
- all states and the U.S.
Relate school district and CBSA geographies using these resources:
• School District to Core-Based Statistical Area (MSA/MISA) Equivalence
• Core-Based Statistical Areas (MSA/MISA) with Component County Population Rankings
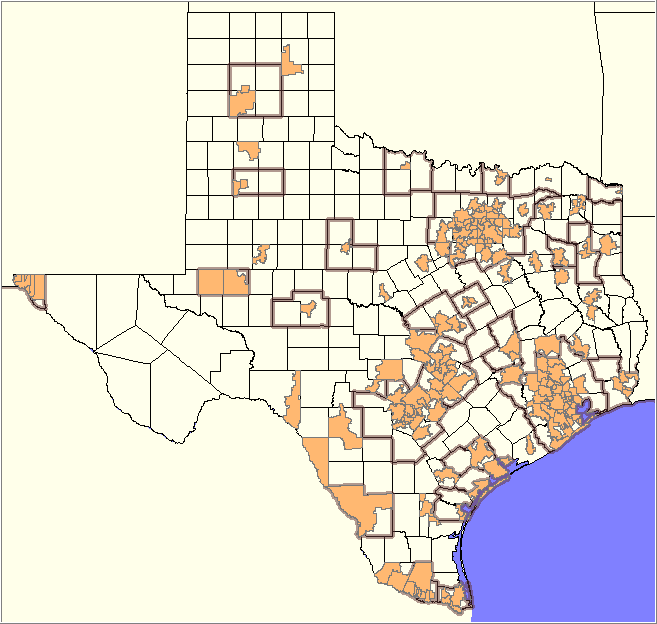
View Scope of School Districts included in ACS 05-07 by Map.
Use CommunityViewer GIS with the SDDynamics dataset to show school districts included.
Districts where demographic updates are available shown with orange fill pattern.
|
Page url: http://proximityone.com/sddynamics/guide/index.htm?introduction.htm