Averill Park CSD, NY SDGIS

Contents
Illustrating use of CommunityViewer to view/analyze K-12 schools, school districts in context of school district community with drill down to the intersection level focused on Averill Park CSD, NY. These views show the Averill Park CSD, NY base level School District GeoDemographic Information System (SDGIS) with selected augmented views. Geocoded student data are not shown.
View demographic-economic trends profile for Rensselaer County, NY; access other county demographic profiles via ranking table links.
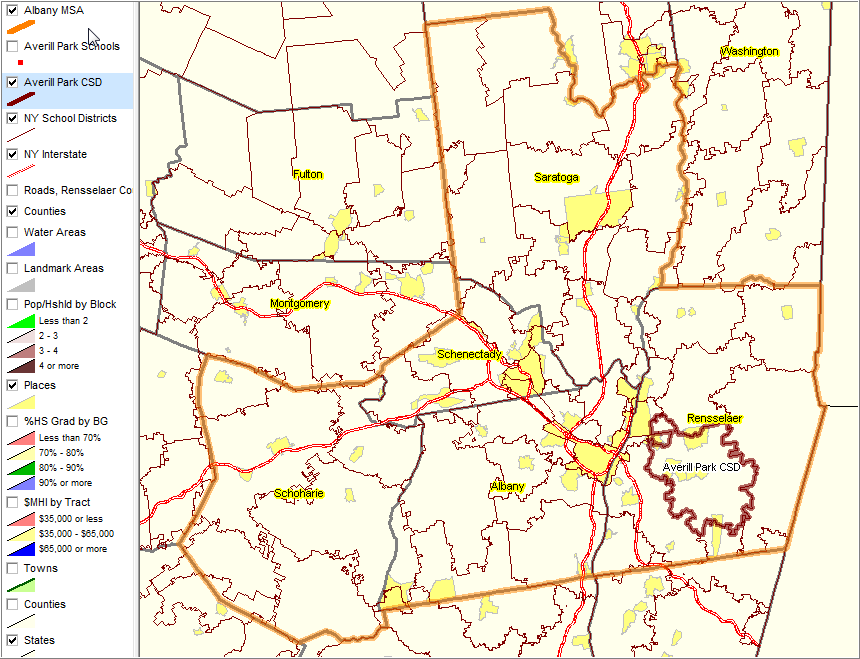
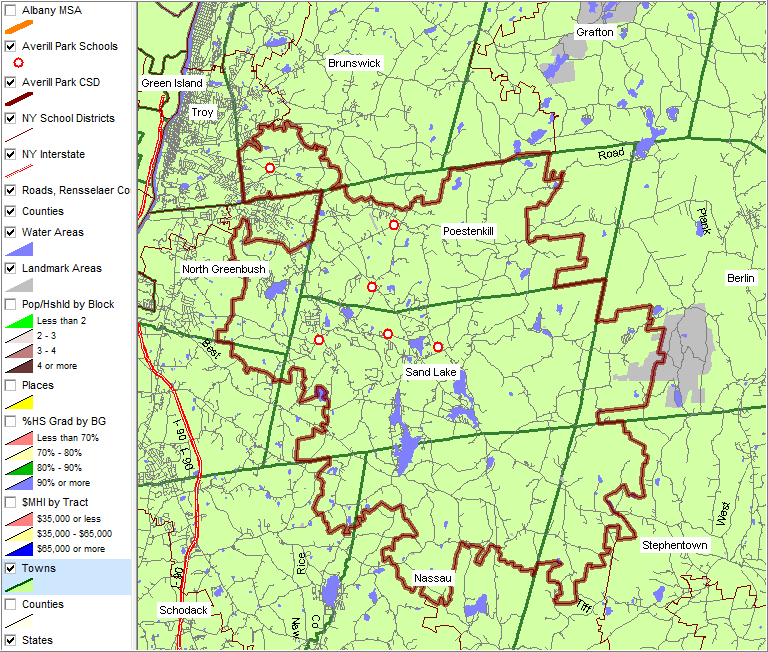
Albany-Schenectady-Troy, NY MSA shown with orange boundary; Averill Park CSD with brown boundary; labeled counties with gray boundaries; places with yellow fill pattern; school districts with light brown boundary.
|
Geocoded student layer not shown.
|
|
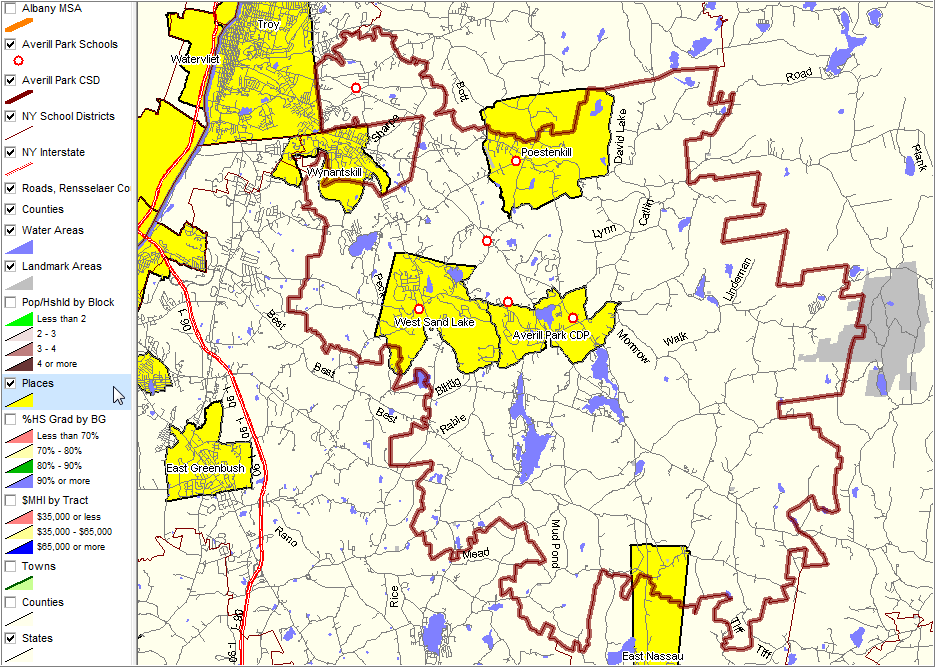
Averill Park CSD intersects with 10 towns. Towns/county subdivisions shown with green fill pattern and dark green boundary. Town labels shown with white solid fill pattern.
|
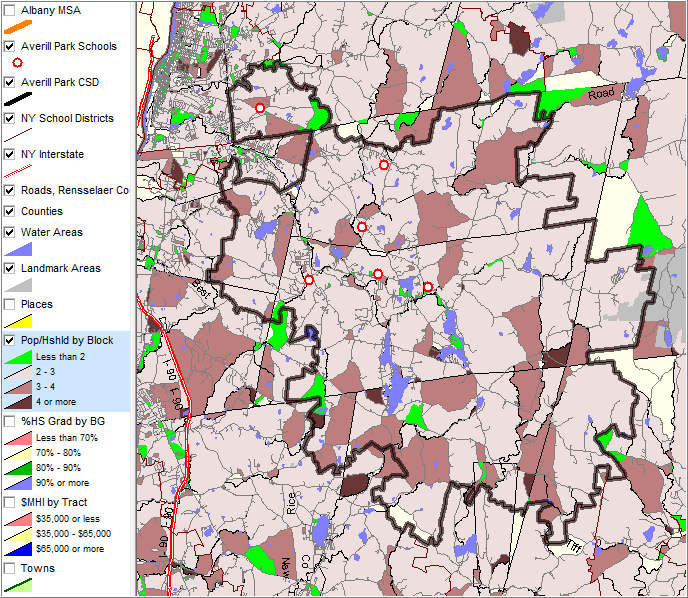
The census block shapefile/layer is not a part of the Base Level SDGIS. It is shown here to illustrate additional available drill down geography. Census blocks are designed to average 100 population and typically conform to conventional blocks in urban areas. This view shows data from Census 2000. See legend at left. Selected demographics will be available from Census 2010 at the census block level in mid-2011.
|
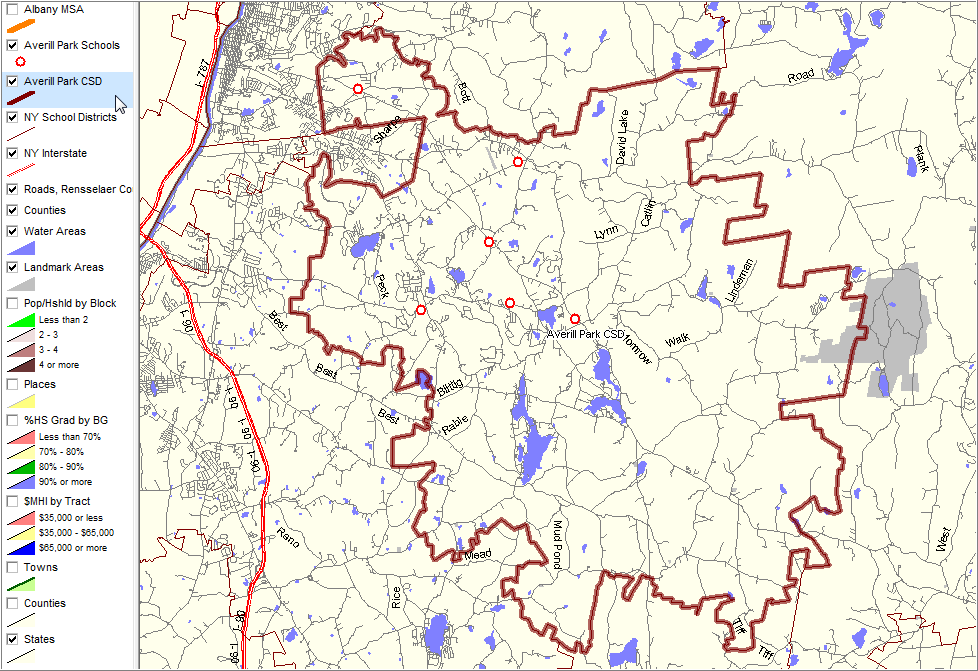
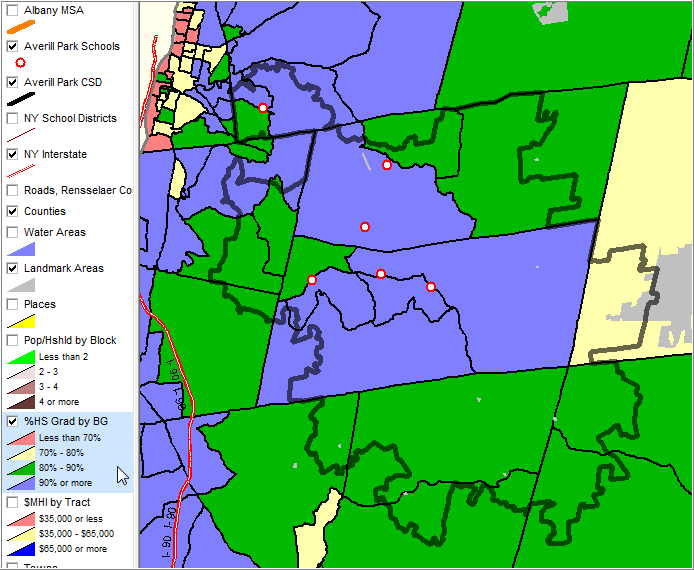
The census block group shapefile/layer is not a part of the Base Level SDGIS. It is shown here to illustrate additional available drill down geography. Block group areas are designed to average 1,000 population. This view shows percent high school graduates data from Census 2000. See legend at left. Selected demographics will be available from the American Community Survey 2005-09 at the census block group level in late 2010.
|
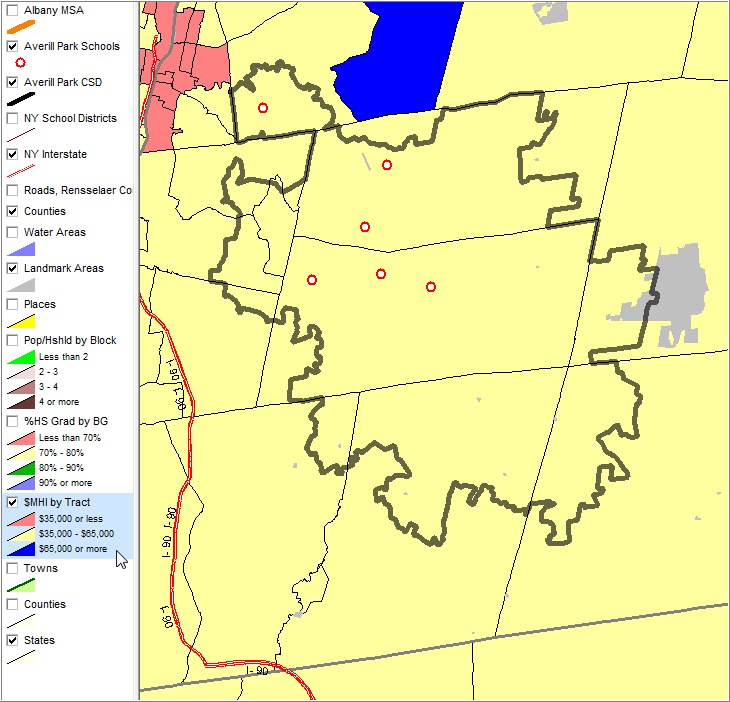
The census block group shapefile/layer is not a part of the Base Level SDGIS. It is available as an option. Census tracts are designed to average 4,000 population. It is shown here to illustrate additional available drill down geography. This view shows median household income data from Census 2000. See legend at left. Selected demographics will be available from the American Community Survey 2005-09 at the census tract level in late 2010.
|