|
|


California School Districts |

|

|

|

|

|
||
|
California School Districts |
|
|
|

|

|

|
California School Districts
|
|
|
California School Districts |
|
|
|
|
|
||
|
California School Districts |
|
|
|
|
|
|
|
|
||
This section is focused on examples using Census 2010 California unified school districts. Note that the Census Bureau differentiates school districts as unified (summary level 970), secondary (summary level 960) and elementary (summary level 950).
See Gallery sections relating to geography/demographics also covered in this section:
| • | California by county and school district -- http://proximityone.com/gallery/guide/index.htm?california.htm |
| • | Santa Clara County and school districts -- http://proximityone.com/gallery/guide/index.htm?ca_santaclara.htm |
Applications in this section were developed by initially downloading the 9 PCT12 tables for all California unified school districts. In that first step (downloading), the 9 files were saved to c:\m2\ca_usd. In the M2 File>Create operation, the the M2 dataset c:\m2\causd.dbf was created. This M2 dataset is included in the M2 setup.
The toggle graphic -- ![]() -- and text colored in this manner indicate an expanding section.
-- and text colored in this manner indicate an expanding section.
Click the toggle or toggle line to view/close expanding sections.
Examples of Grid 3 Multicultural Age Cohorts Saved as HTML files
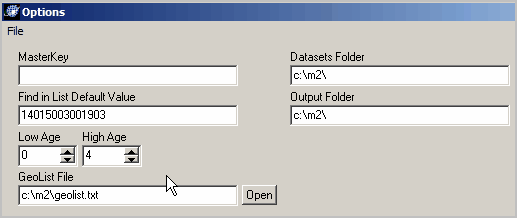
Use the Options>Set Options to set the age range used in Grid3. The following view shows how the age range is set to 0-4 years.
The options form is closed, Go button clicked on main form and the revised Grid3 is displayed.
The following expanding text sections show the HTML output when the File>SaveGrid to HTML is used. The age group/range setting was changed and the Grid display regenerated for each view.
The comparative analysis format shows side-by-side demographics for Long Beach Unified, Los Angeles Unified and San Diego Unified school districts.
|
|||||||||||||||||||||||||||||||||||||||||||||||||||||||||||||||||||||||||||||||||||||||||||||||||||||||||||||||||||||||||||||||||||||||||||||||||||||||||||||||||||||||||||||||||||||||||||||||||||||||||||||||||||||||||||||||||||||||||||||||||||||||||||||||||||||||||||||||||||||||||||||||||||||||||||||||||||||||||||||||||||||||||||||||||||||||||||||||||||||||||||||||||||||||||||||||||||||||||||||||||||||||||||||
Similar steps were used for ages 5-17. The following expanding text section shows the HTML output for this age group.
|
|||||||||||||||||||||||||||||||||||||||||||||||||||||||||||||||||||||||||||||||||||||||||||||||||||||||||||||||||||||||||||||||||||||||||||||||||||||||||||||||||||||||||||||||||||||||||||||||||||||||||||||||||||||||||||||||||||||||||||||||||||||||||||||||||||||||||||||||||||||||||||||||||||||||||||||||||||||||||||||||||||||||||||||||||||||||||||||||||||||||||||||||||||||||||||||||||||||||||||||||||||||||||||||
Similar steps were used for ages 18-34. The following expanding text section shows the HTML output for this age group.
|
|||||||||||||||||||||||||||||||||||||||||||||||||||||||||||||||||||||||||||||||||||||||||||||||||||||||||||||||||||||||||||||||||||||||||||||||||||||||||||||||||||||||||||||||||||||||||||||||||||||||||||||||||||||||||||||||||||||||||||||||||||||||||||||||||||||||||||||||||||||||||||||||||||||||||||||||||||||||||||||||||||||||||||||||||||||||||||||||||||||||||||||||||||||||||||||||||||||||||||||||||||||||||||||
Any age interval setting can be used in the range 0 to 100.
