|
|


Congressional District Applications |

|

|

|

|

|
||
|
Congressional District Applications |
|
|
|

|

|

|
Congressional District Applications
|
|
|
Congressional District Applications |
|
|
|
|
|
||
|
Congressional District Applications |
|
|
|
|
|
|
|
|
||
This section is focused on examples using Census 2010 Congressional Districts (CD 111). See more about congressional district demographic analysis at http://proximityone.com/cd.htm.
The toggle graphic -- ![]() -- and text colored in this manner indicate an expanding section.
-- and text colored in this manner indicate an expanding section.
Click the toggle or toggle line to view/close expanding sections.
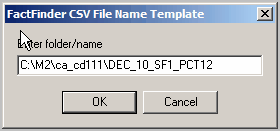
Applications in this section were developed by initially downloading the 9 PCT12 tables for all California congressional districts. In that first step (downloading), the 9 files were saved to c:\m2\ca_cd111. In the M2 File>Create operation, the template prompt was modified as shown here:
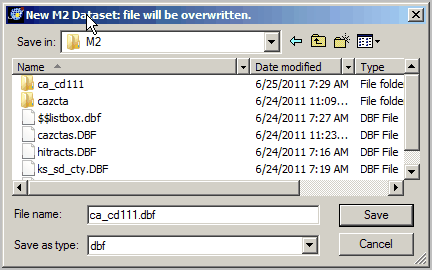
The new file was saved with M2 dataset name c:\m2\cd_cd111.dbf:
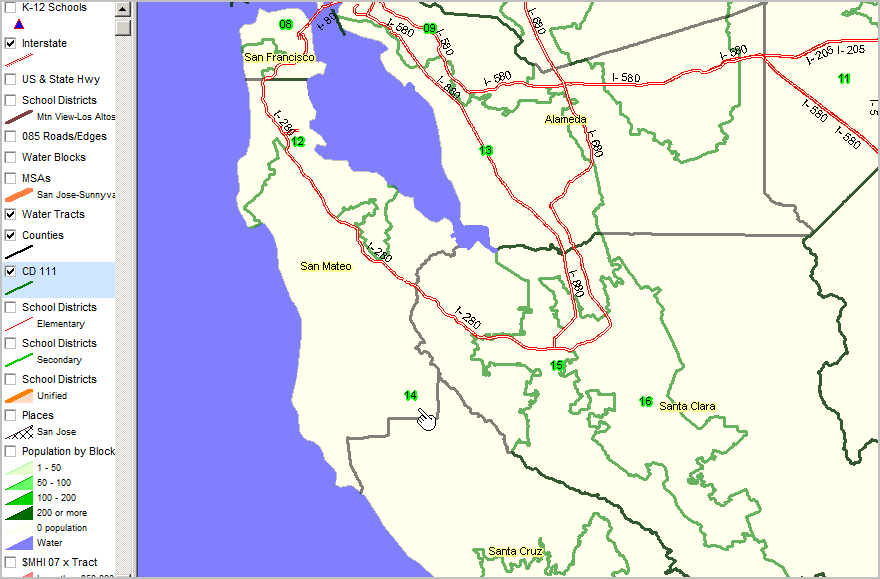
Using M2, the M2 dataset c:\m2\ca_cd111.dbf is opened using File>Open. |
CDs appear with green boundaries and labels. Counties appear with bold black boundaries and yellow labels. See pointer by CD 14; CD 15 and 16 located to east of of CD 14.
|
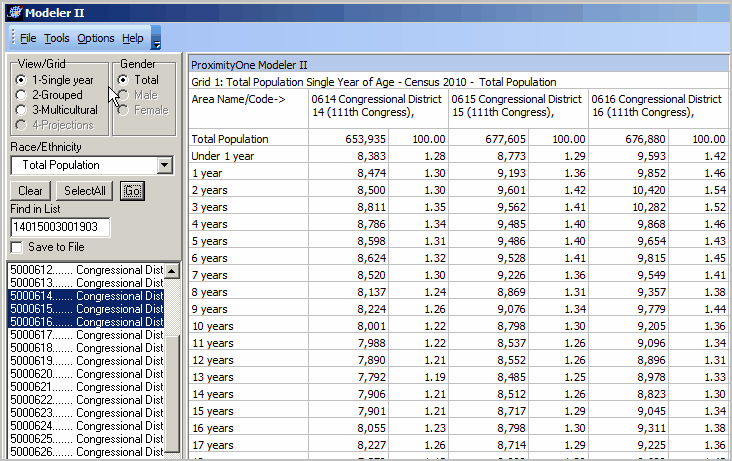
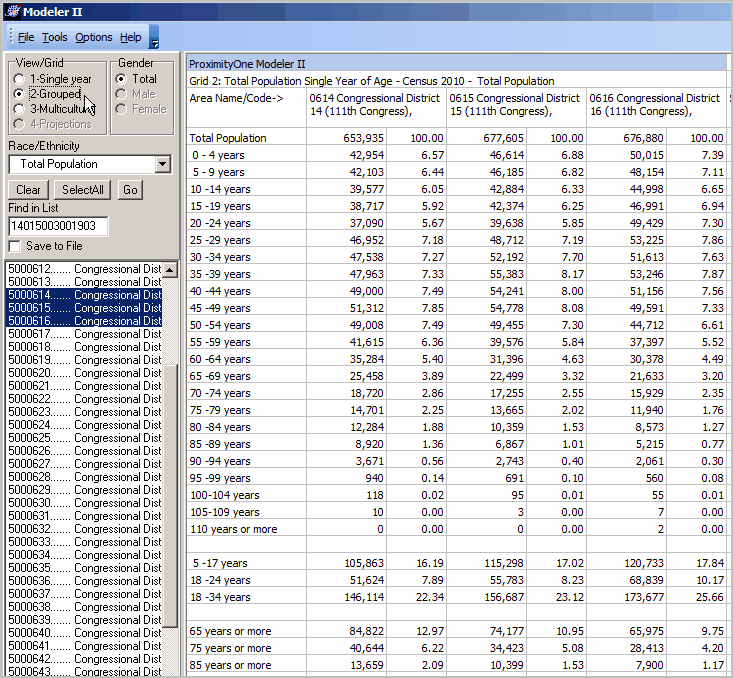
Side by Side Comparison of three congressional districts -- single year of age. To replicate this view (using M2 on your computer), click Clear then multi-select the three CDs.
|
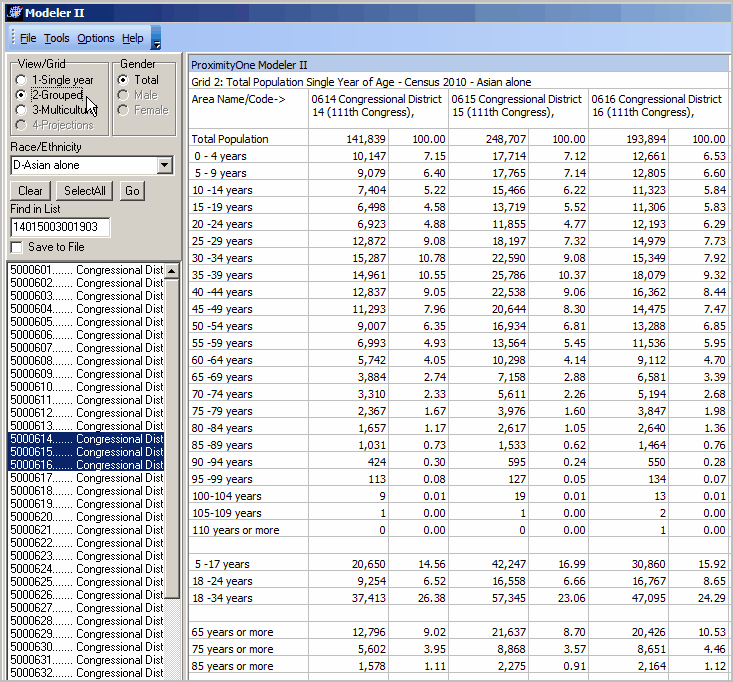
Side by Side Comparison of three congressional districts -- selected age groups for the Asian Alone population. To replicate this view (using M2 on your computer), click Clear then multi-select the three CDs.
|
Side by Side Comparison of three congressional districts -- view as above but for Asian Alone population. To replicate this view (using M2 on your computer), click Clear then multi-select the three CDs.
|
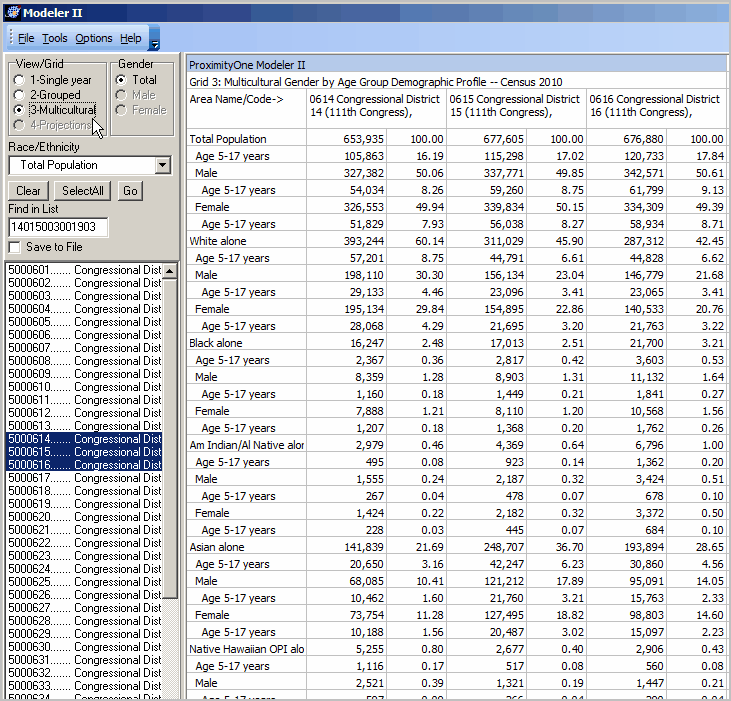
Side by Side Comparison of three congressional districts -- multicultural demographics for selected age range. To replicate this view (using M2 on your computer), click Clear then multi-select the three CDs.
|