|
|


Getting Started |

|

|

|

|

|
||
|
Getting Started |
|
|
|
|

|

|
Getting Started
|
|
|
Getting Started |
|
|
|
|
|
||
|
Getting Started |
|
|
|
|
|
|
|
|
||
A summary sequence of steps to view PCT12 age detail for areas of interest are as follows:
| • | Start M2. |
| • | Use File>Open and open the M2 PCT12 dataset of interest (available geography appears in left section listbox) |
| • | Select an area of interest listed in the listbox (dbl-click one geocode/item or multi-select). |
| • | Table displays in grids. |
| • | Optionally repeat with different geographic selections. |
| • | Optionally export grid views to CSV files. |
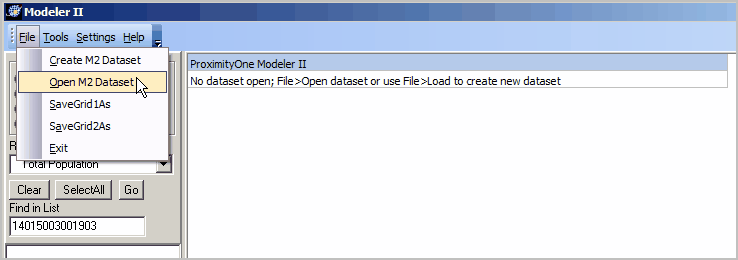
At start-up, the first step is to Create M2 Dataset or Open M2 Dataset.
In this example, the File>Open is used to open an existing M2 dataset.
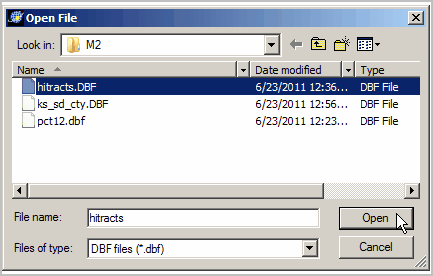
When the OpenFile dialog appears, choose the tracts_12.dbf dataset and click Open button.
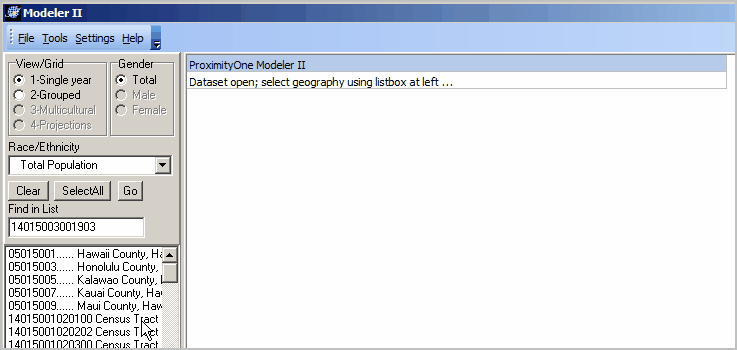
Upon Opening a dataset, the listbox at the left is populated with geocodes for available geographic areas in the active dataset.
In this example, both counties and census tracts are being used.
Each line/row in the listbox corresponds to a geographic area (in this case, a county or tract).
The listbox shows the area geocode followed by the area name.
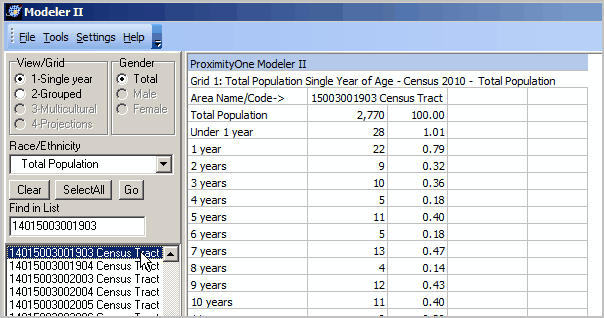
To view data for the tracts shown in the map presented above, the Find in List feature is used.
Dbl-clicking the Find box, the listbox position is navigated so this tract appears at the top of the listbox.
To view a profile for a tract(area), dbl-click the corresponding geocode in the listbox.
For example, to view the profile for tract 15-001-020100, click the corresponding line/item (see pointer).
This view (Grid 1) shows a row for each age.
The year of age appears in the left column; the population for the tract (area) in that age appears in the next column.
The percent of the population in that age appears in the next column.
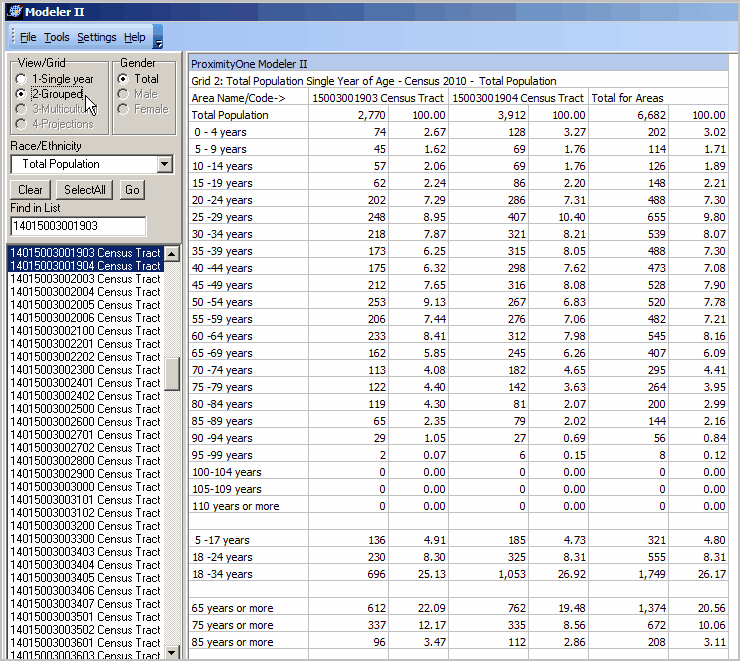
To view multiple tracts (areas) side-by-side, and the totals across these areas, multi-select areas using the listbox.
Multi-select by holding down the Ctrl key, clicking each tract (area) code desired, dbl-clicking the final tract (area) code to be included.
In the following example, two tracts are selected.
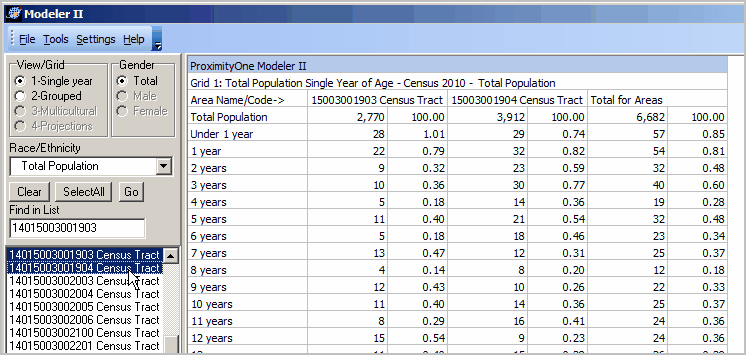
To view population by age group, click the radiobutton "2-Grouped"; the result appears as shown below.
Click the radiobuttons back-and-forth, the view/compare single year of age population with population by age group.