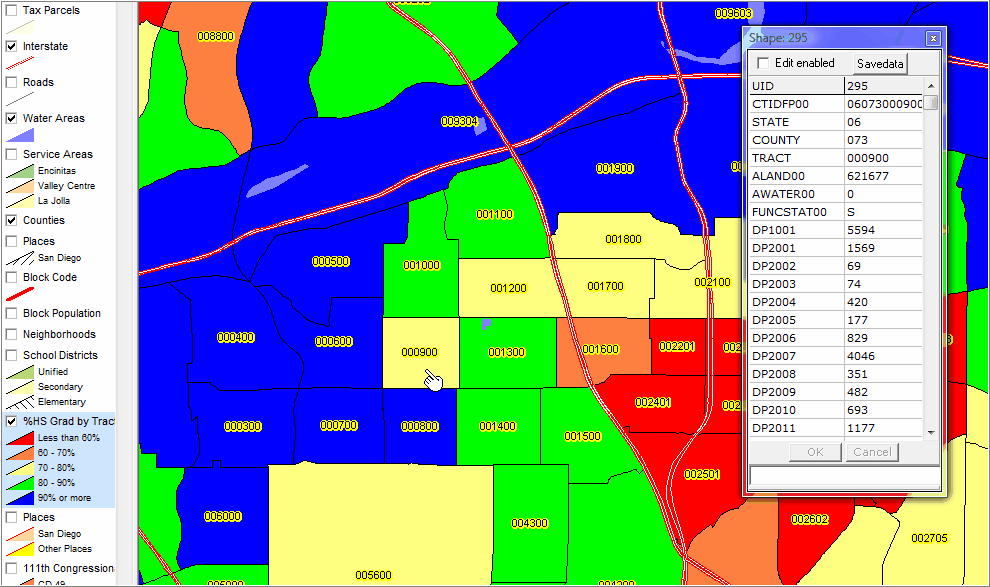
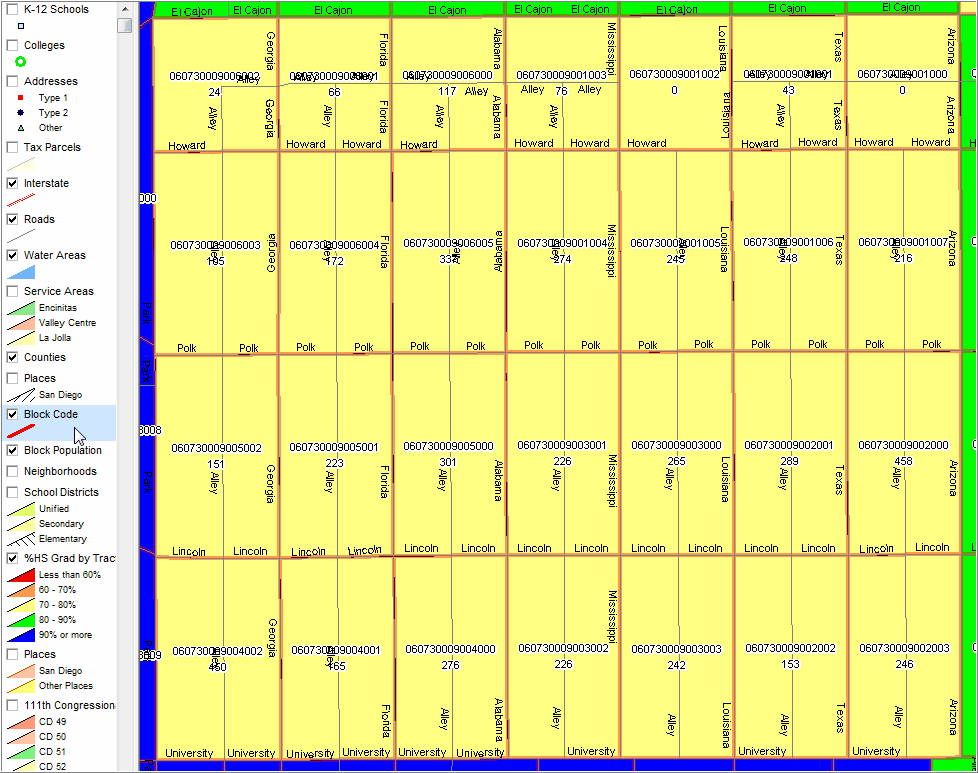
San Diego GeoDemographic Analysis

Census Blocks

Census Blocks

Previous topic Next topic No directory for this topic Expand/collapse all hidden text Mail us feedback on this topic!  

Census Blocks

Previous topic Next topic Topic directory requires JavaScript JavaScript is required for expanding text JavaScript is required for the print function Mail us feedback on this topic!  


Census Blocks; Population Density and Related Views

See related Census Blocks Geodemographics pages.

Views

Census blocks are the smallest geographic tabulation area for the decennial census.

27,937 census blocks cover San Diego County wall-to-wall (of the 8.2 million census blocks covering the U.S., two-thirds are water blocks.

See population density color-value patterns in legend section.

Zoom-in to San Diego city area north of Balboa Park.  View of census tracts by %high school graduate.

Identify tool (see pointer/hand) used to show mini profile of tract 0009.

Further zoom-in  to tract 0009 now shown with census blocks (red boundary with partial transparency).  Street detail added.

Blocks labeled (upper label) with state-county-tract-block geocode.  Blocks labeled (lower label) with total Census 2000 population.

Blocks with red boundary.  Identify tool used to display mini-profile of selected block.


Content & Usage Details

Path=C:\cv\cafiles\tl_2009_06073_tabblock00.shp

Name=tl_2009_06073_tabblock00_20

Fields:

  FieldName  FieldType  Description
BLKIDFP00C15 
UR00C1 
UACE00C5 
FUNCSTAT00C1 
ALAND00N14.0 
AWATER00N14.0 
INTPTLAT00C11 
INTPTLON00C12 
STATEC2 
COUNTYC3 
TRACTC6 
BLOCKC4 
AREALANDN14.0 
AREAWATRN14.0 
POP100N9.0 
H003001N9.0 
H003002N9.0 
H003003N9.0 
P001001N9.0 
P003002N9.0 
P003003N9.0 
P003004N9.0 
P003005N9.0 
P003006N9.0 
P003007N9.0 
P003008N9.0 
P003009N9.0